Mixed Bar Graph by Product – Visualization for Performance Maximization Strategy
RB0800022_9
- Last Update 03/22/2025
- File Size 1MB
- # of Slides 2
- File Format PPTX
- Slide Ratio 4:3
- Color
Keywords
- #Content-Based Slides
- #Design-Based Slides
- #Business Strategy
- #Financial Plans and Performance
- #Graph
- #Other
- #Achievements
- #Sales and Revenue
- #4:3
- #mixed bar chart PowerPoint
- #product performance comparison slide
- #sales data visualization PPT
- #how to create a mixed chart in PowerPoint
- #financial analysis graph presentation
About the Product
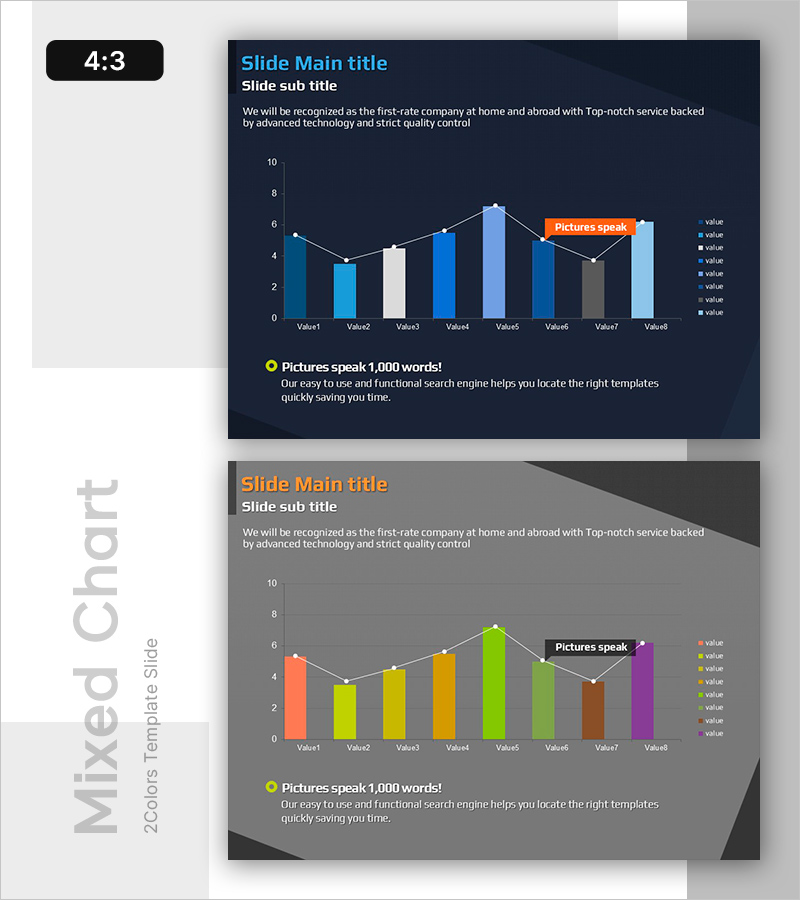
A PowerPoint slide that visualizes product sales performance using a mixed bar chart with combination line overlay. Features a dark blue background with orange accent elements in two design layout variations. The upper section includes title, subtitle, and descriptive text areas. The center displays a chart comparing eight data points across multiple series using bars and line graphs. The bottom section contains a yellow circular badge highlighting key insights with supporting text. Immediately applicable for financial reports, business performance presentations, and marketing analysis materials.
Usage Points
-
Main Usage
Simultaneously displays multiple product metrics such as revenue, profit margins, and market share using combined bar and line graphs, enabling quick comparison and trend analysis. Optimized for financial clarity and supporting data-driven decision-making in executive presentations.
-
How to Use
Apply to financial report revenue analysis sections, business performance presentations comparing product results, and marketing strategy documents analyzing market share. Edit chart data directly with actual figures and customize title and description text to match your presentation context.
-
Recommended For
Finance and marketing team members preparing quarterly reports, investor relations professionals, business performance analysts, product portfolio managers, and executives presenting sales results to stakeholders.
-
Slide Structure
Upper section with title, subtitle, and descriptive text (3 lines); center mixed chart displaying eight data points across multiple series with line overlay; legend with nine items; lower section with yellow emphasis badge and supporting message (2 lines). Available in two color themes: dark blue and gray.
Related Products
-

Camera and Vertical Stacked Charts Slide
#Business Strategy #Financial Plans and Performance #Graph
-

Management Performance Analysis Mixed Chart – Visualizing Strategies and Achievements
#Business Strategy #Market and Competitor Analysis #Graph
-

Coffee Consumption Survey by Gender – Visual Data Infographic
#Market and Competitor Analysis #Financial Plans and Performance #Diagram
-

Alimony Ranking Graph – Visualizing Financial Performance
#Financial Plans and Performance #Graph #Other
