Market and Competitor Analysis
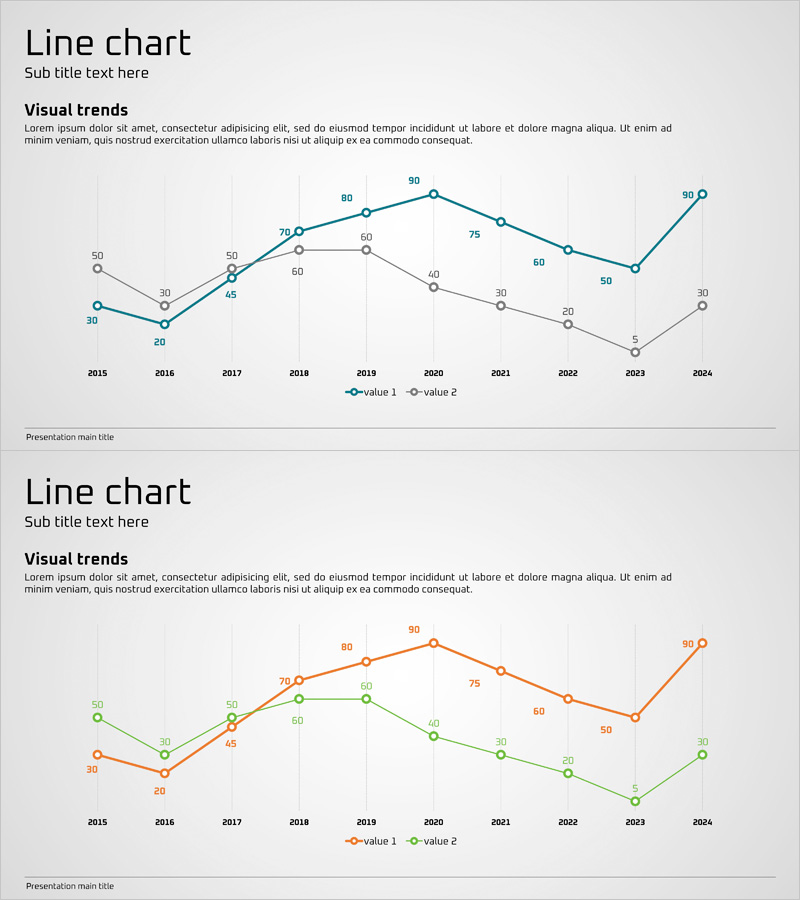
Service Future Outlook Graph – Visualized in Blue, Orange, and Green
RJ0400017_6
- Last Update 12/21/2025
- File Size 0.2MB
- # of Slides 2
- File Format PPTX
- Slide Ratio 16:9
- Color
Keywords
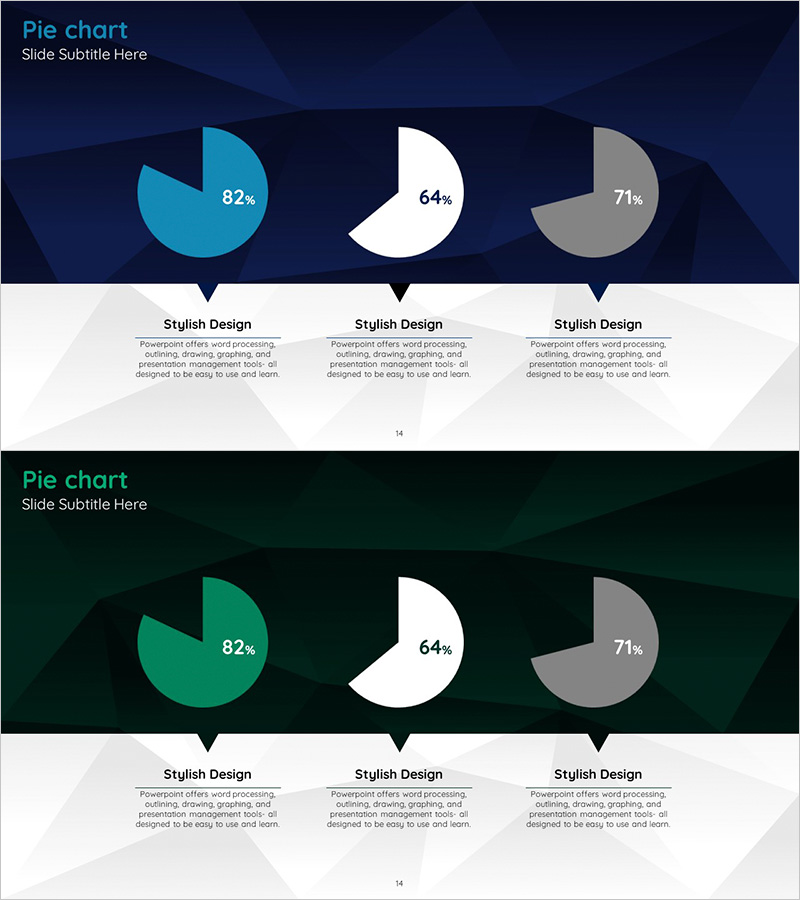
About the Product
This slide visualizes the future outlook of services in a line graph format, helping to easily understand the flow of data. It uses shades of blue, orange, and green to distinctly differentiate between various data sets, presenting a modern and organized design. This slide is ideal for market and competitor analysis, business forecasting, and strategic planning presentations. It is designed for immediate practical use in professional settings, with easy text and data entry.
Related Products
-
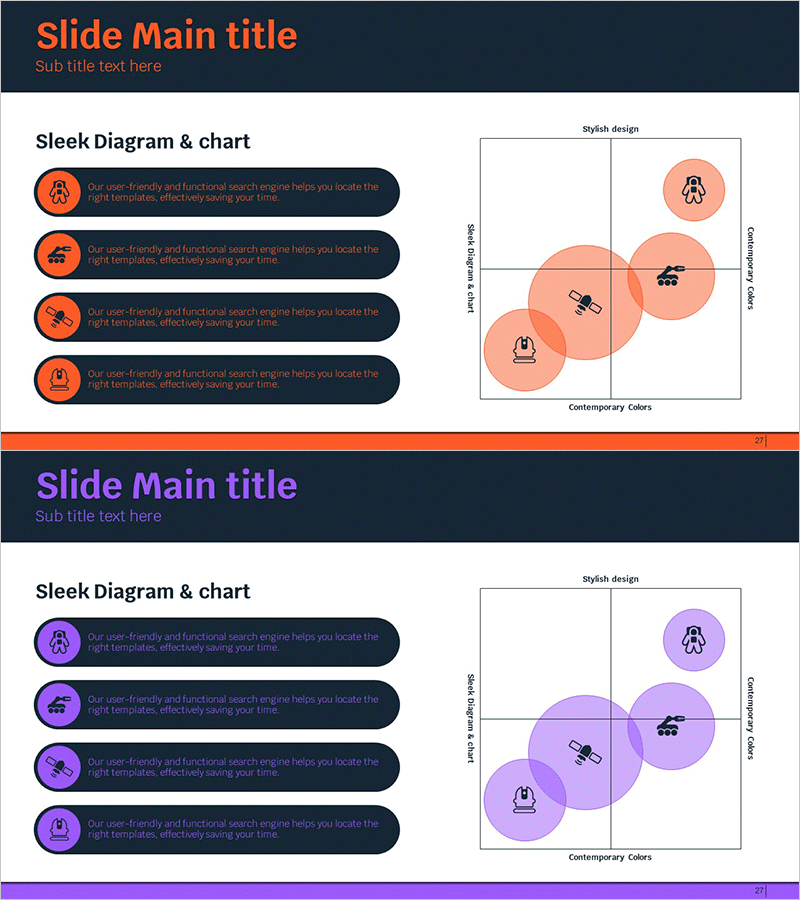
Space Industry Positioning Diagram – Market Analysis and Strategy
#Market and Competitor Analysis #Marketing Plan and Strategy #Diagram
-
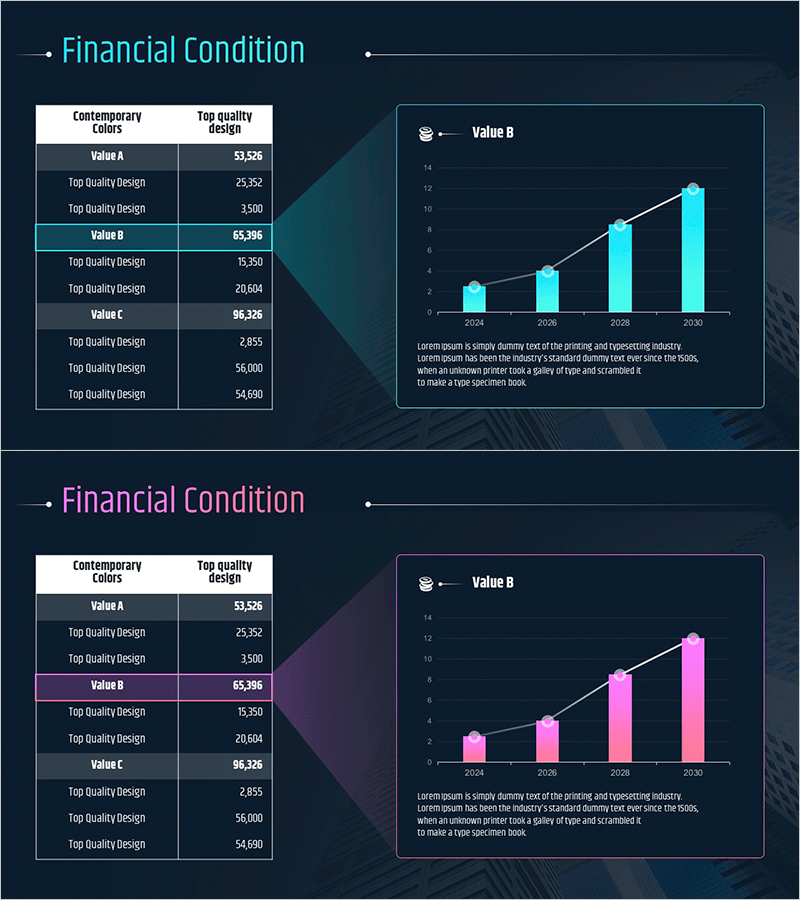
Revenue Growth Analysis Graph & Table - Financial Condition and Data Visualization
#Business Introduction #Diagram #Graph
-
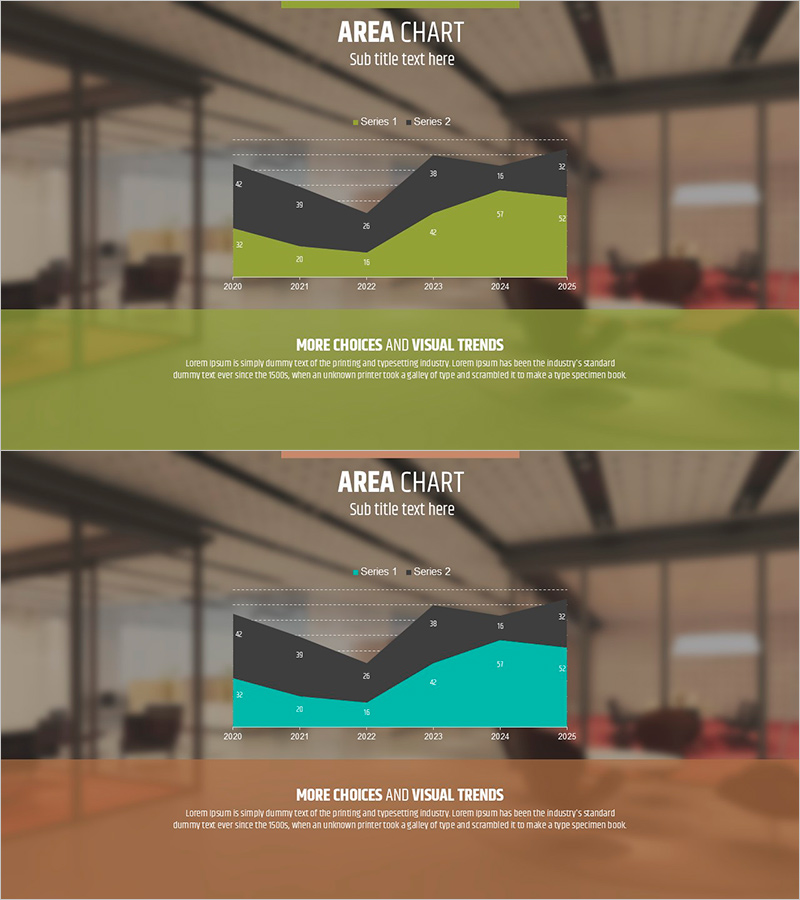
Green Brown Area Chart – Market and Competitor Analysis
#Market and Competitor Analysis #Graph #Other
-
Company Major Performance and Development Status Pie Chart – Blue Green
#Company Introduction #Product/Service #Graph
