Free Graphs
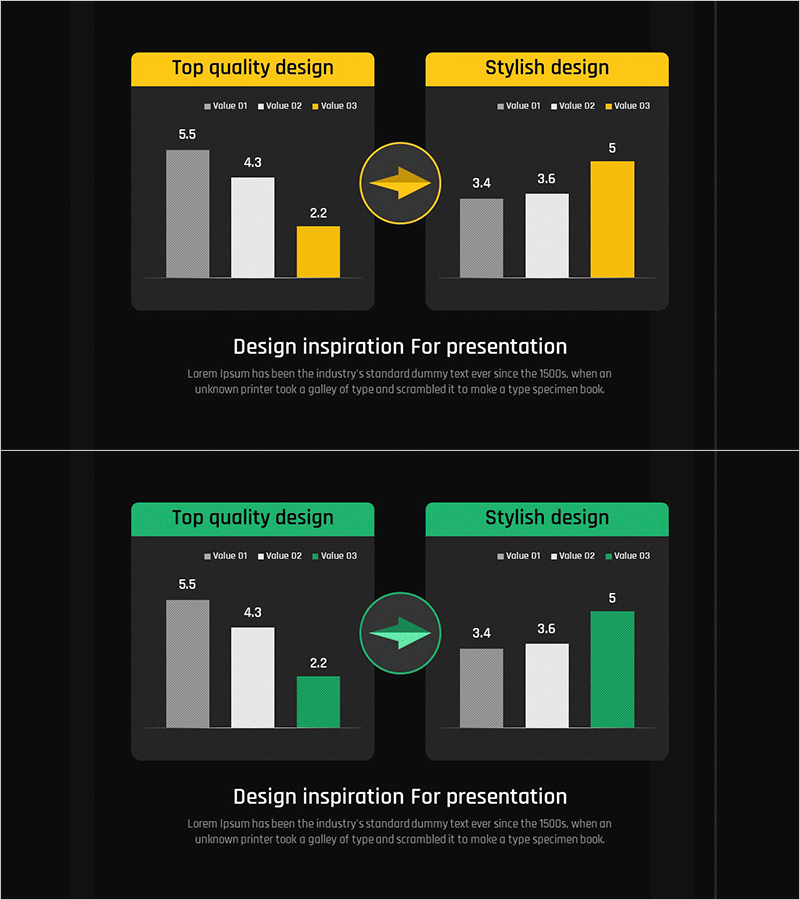
Future Market Analysis Graph – Explaining the Future with Data Visualization
RJ0300092_13
- Last Update 12/21/2025
- File Size 1.1MB
- # of Slides 2
- File Format PPTX
- Slide Ratio 16:9
- Color
About the Product
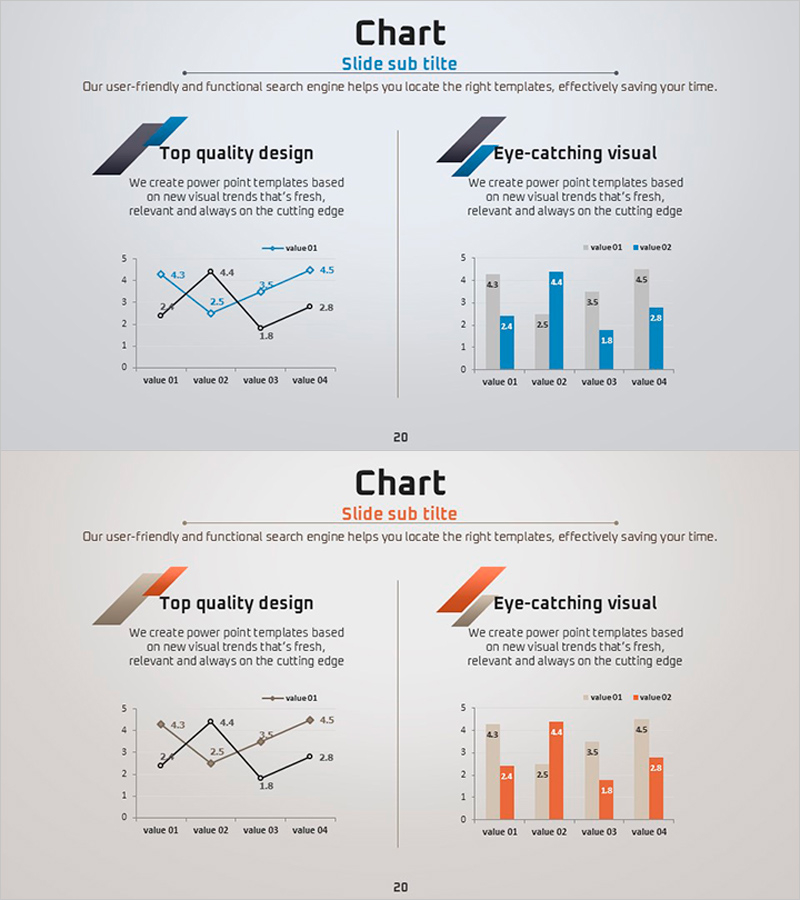
This slide features a graph that effectively visualizes future market analysis. With a sleek design and clear data structure, it presents critical market trends at a glance. The slide harmonizes yellow and green colors, making the forecast data visually appealing. It's useful for data-driven strategy formulation and decision-making in various business scenarios such as investor reports and strategic plans. Designed for easy editing, the text and data can be modified with convenience.
Related Products
-
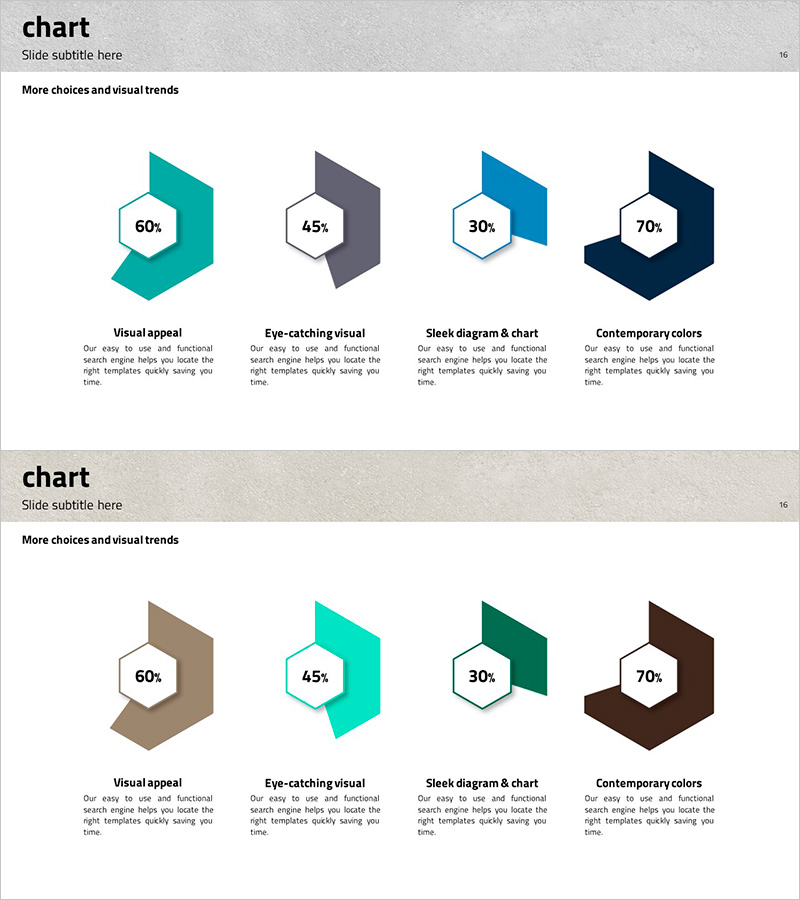
Introducing Products and Services with Hexagonal Chart – Achieving Marketing Goals
#Free Graphs
-
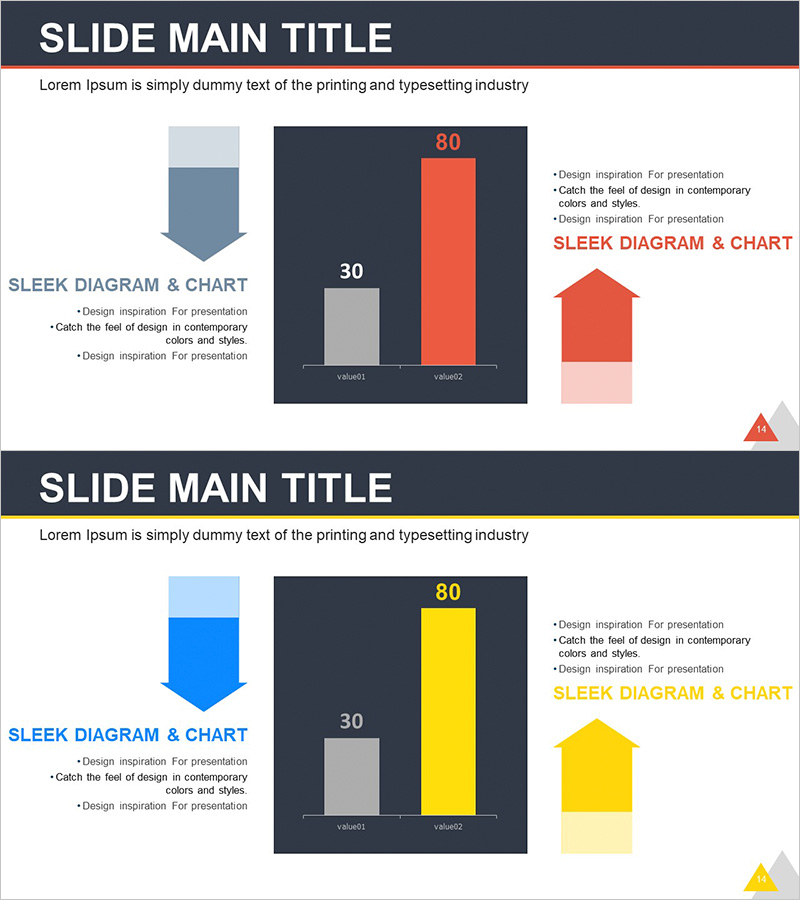
Bar Chart of Decline & Rise Analysis – Emphasizing Market Competitiveness
#Free Graphs
-
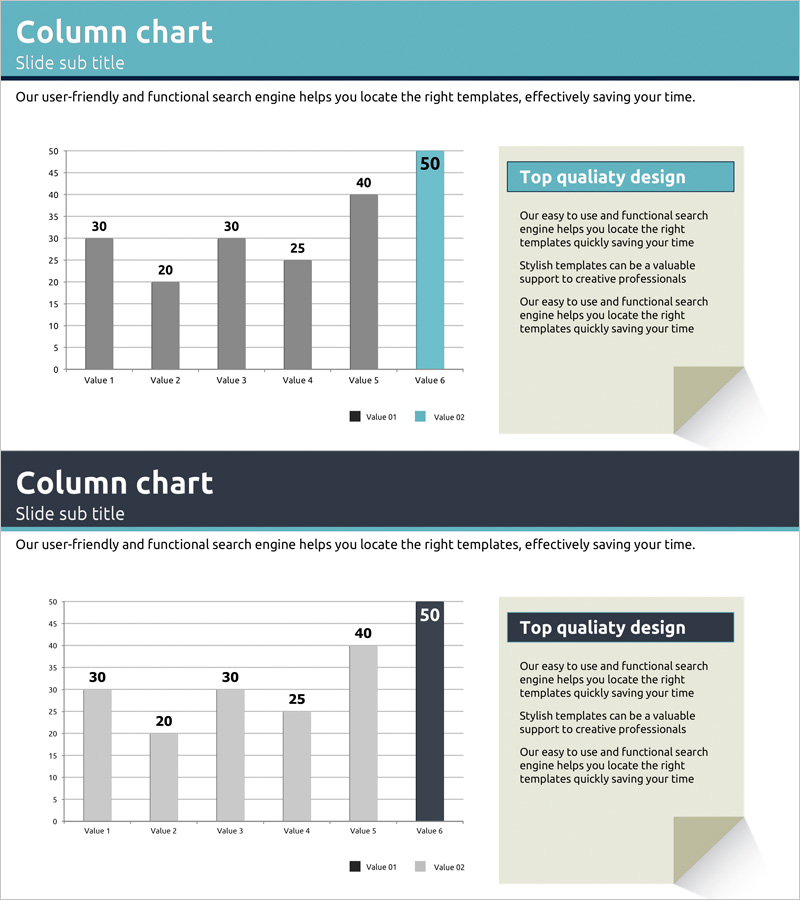
Column Chart for Market Status and Future Prospects – Harmony of Blue and Navy
#Free Graphs
-
Blue Orange Chart Analysis – Eye-Catching Data Visualization
#Free Graphs
