Free Graphs
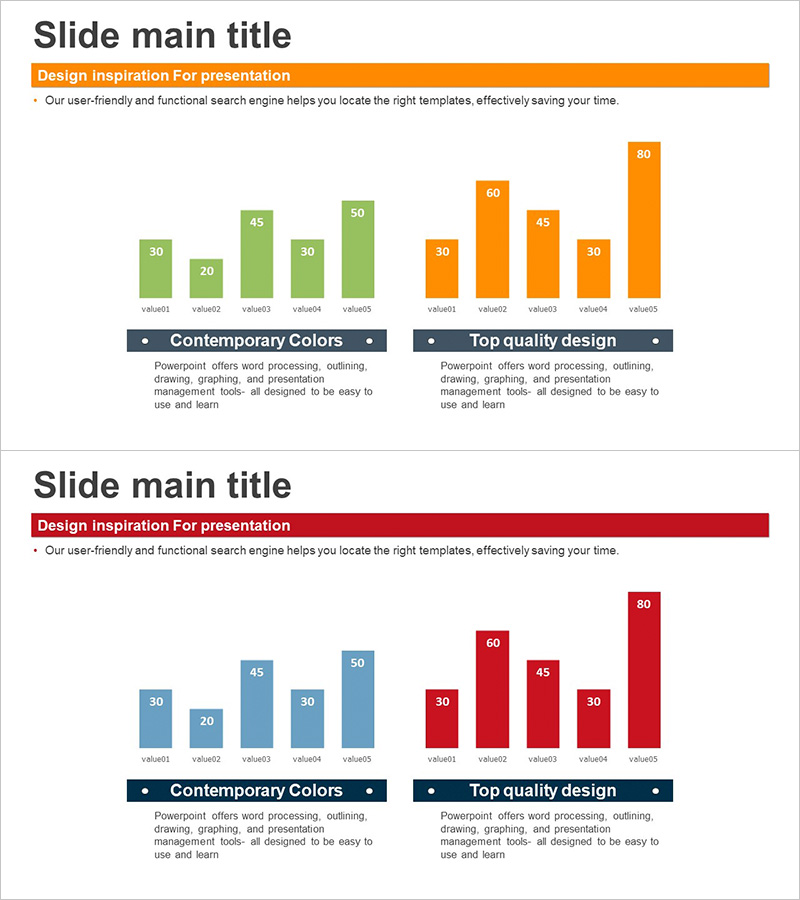
Comparative Analysis Bar Graph – Optimal Choice for Market and Competitor Analysis
RJ0300064_14
- Last Update 12/21/2025
- File Size 0.1MB
- # of Slides 2
- File Format PPTX
- Slide Ratio 16:9
- Color
Keywords
About the Product
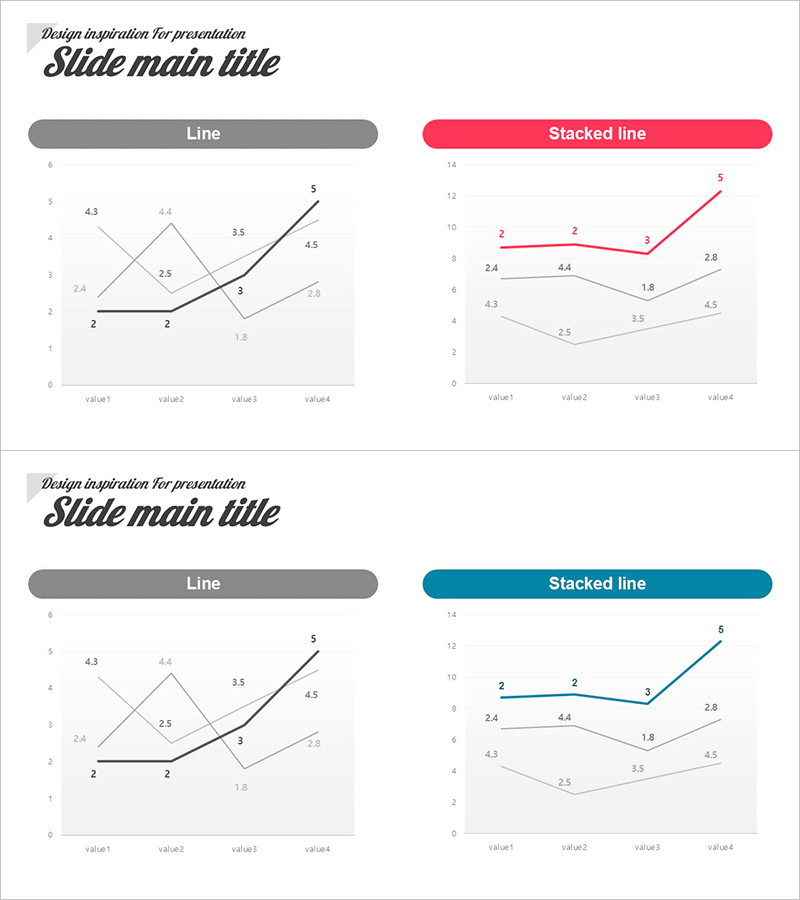
This slide utilizes a bar graph for comparative analysis, providing a clear visualization of market and competitor data. The bright and modern combination of orange and red enhances data readability, with a visual flow that effectively communicates important information. Ideal for market analysis reports, competitor comparisons, or management strategy meetings. The pre-prepared text areas are easily modifiable, and the editing difficulty is rated as 'easy,' making it versatile for various presentations.
Related Products
-
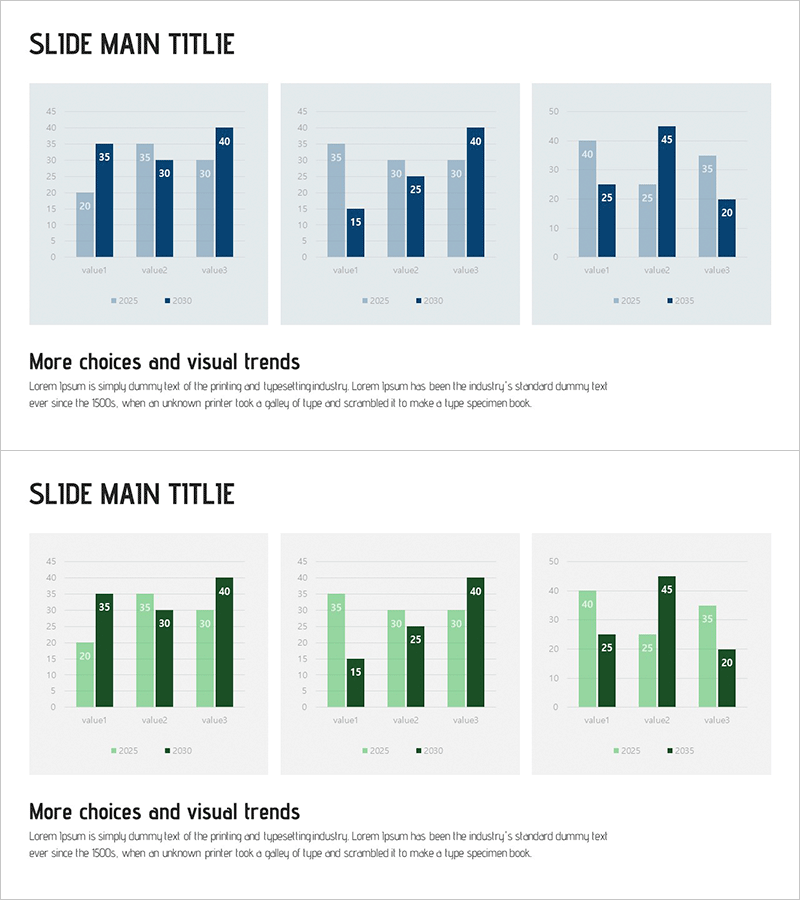
Vertical Bar Chart Visualizing Candidate Values – Trends and Choices
#Free Graphs
-
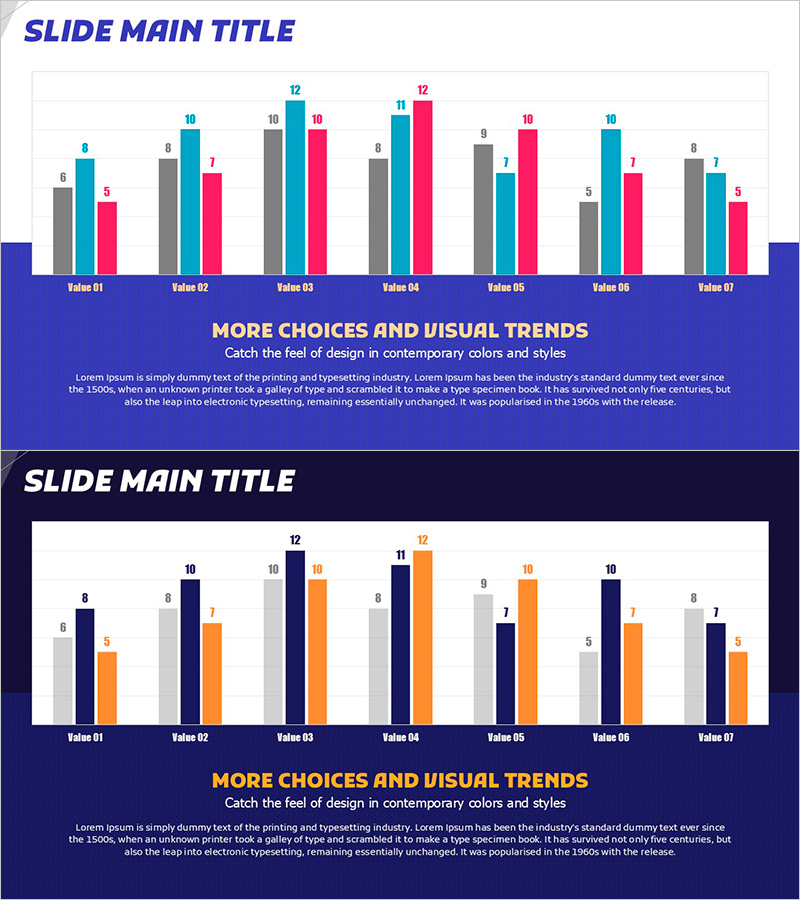
Vertical Bar Chart for Data Analysis – Business Insights
#Free Graphs
-
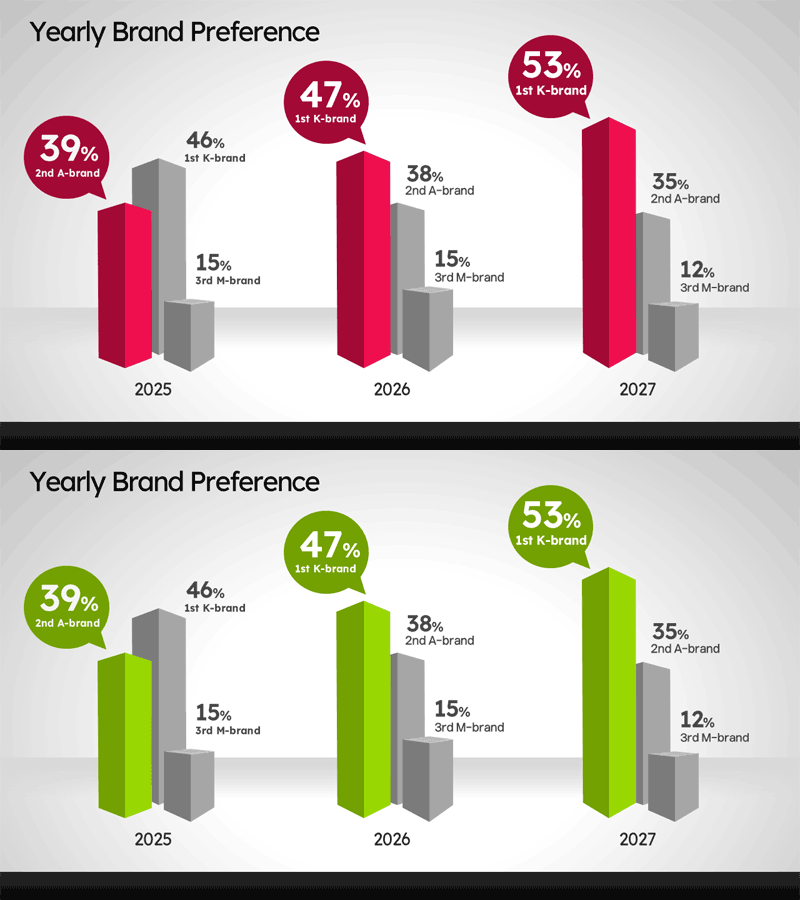
Free 3-Year Brand Preference Vertical 3D Bar Chart PowerPoint Template – Yearly Data Comparison Slide
#Free Graphs
-
Data Visualization Presentation Slide Using Line Charts
#Free Graphs
