Product/Service
Business Development Status Analysis Graph – Key Insight Visualization
RJ0300060_8
- Last Update 12/21/2025
- File Size 0.3MB
- # of Slides 2
- File Format PPTX
- Slide Ratio 16:9
- Color
Keywords
About the Product
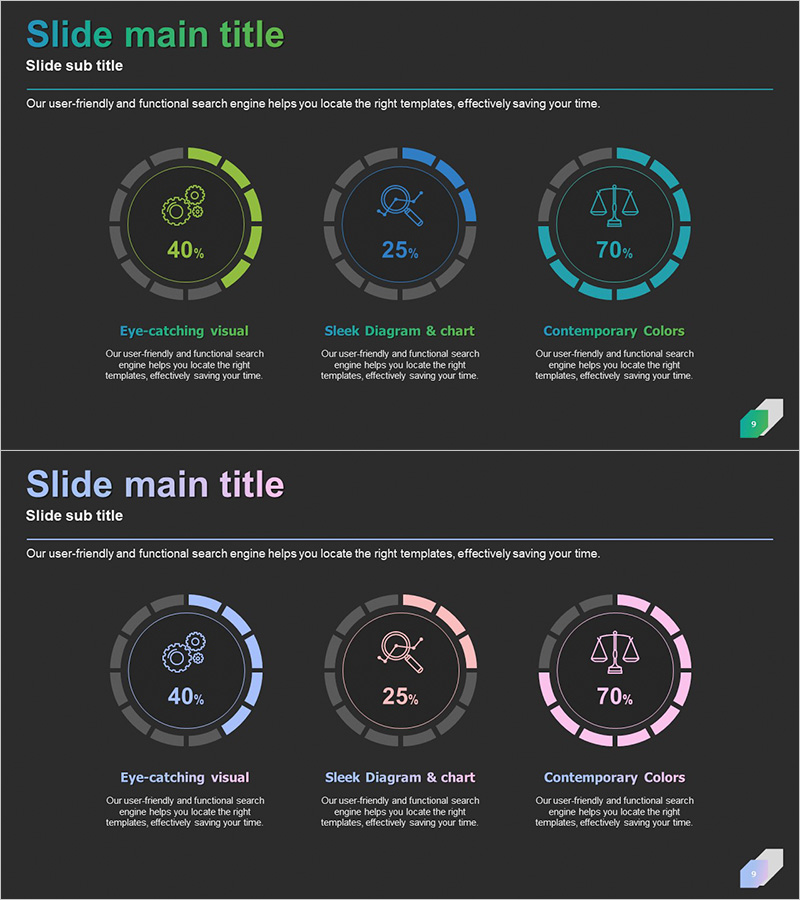
This slide features a doughnut chart template designed to present business development status clearly and intuitively. The harmonious color combination of green and purple enhances the visual layout of the results, making it perfect for analyzing market shares and competitors. It is particularly effective for practitioners and strategic planning departments when presenting critical data. Text and figures are easily interchangeable, with an overall editing difficulty rated as 'easy', allowing for quick adaptation in various presentations.
Related Products
-
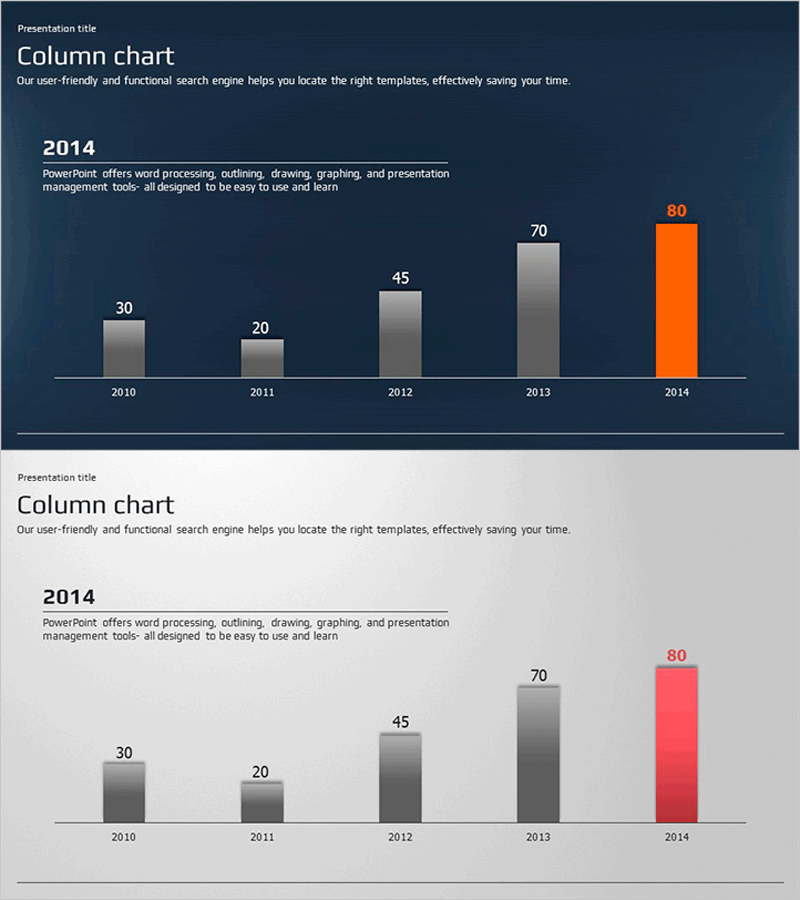
Global Business PowerPoint Template – Wide Vertical Bar Graph
#Company Introduction #Market and Competitor Analysis #Graph
-
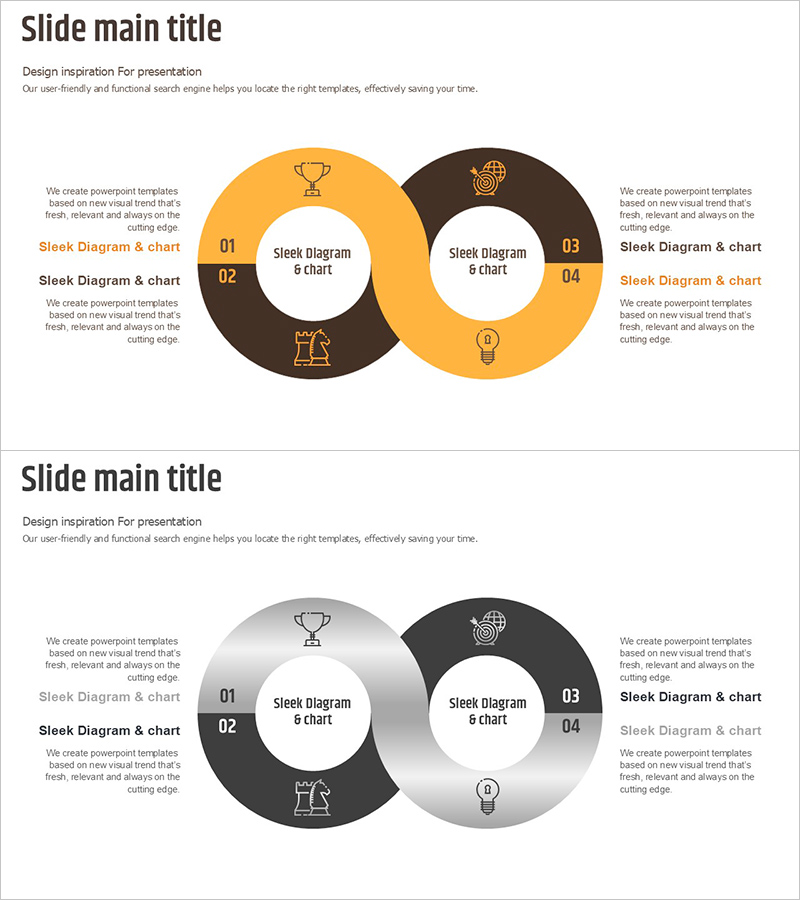
Creative Connection Diagram – Product and Service Differentiation Strategy
#Product/Service #Operation Plan #Diagram
-
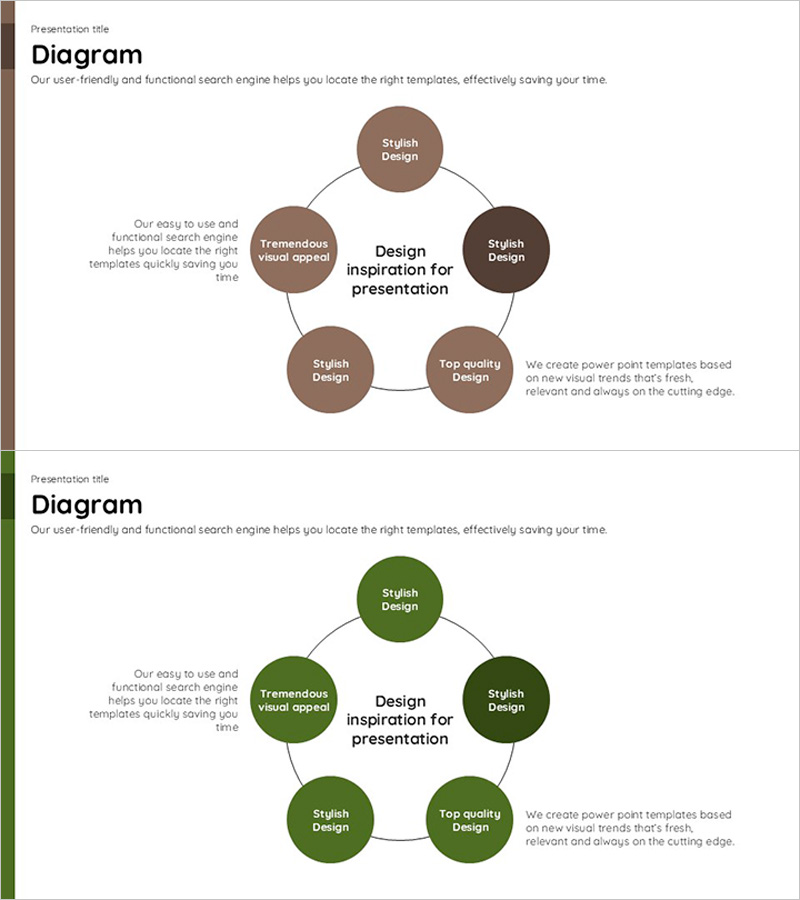
Connection and Diffusion Circular Diagram – Delivering Core Values of Products and Services
#Product/Service #Business Vision and Strategy #Diagram
-
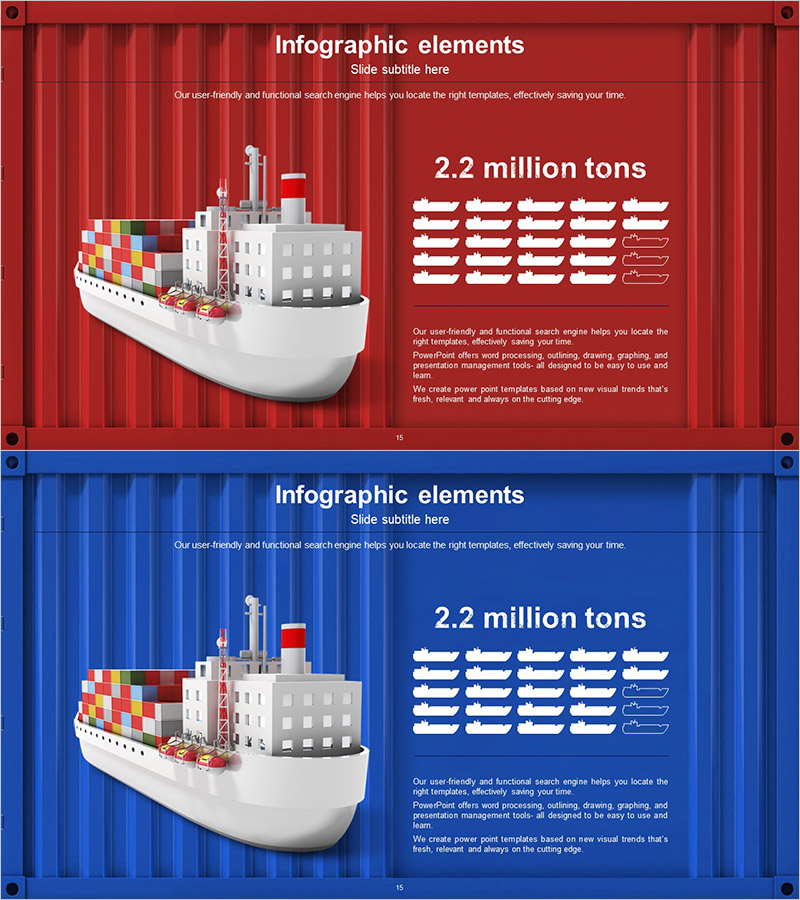
Maritime Freight Volume Chart – Understanding Marine Logistics Data
#Product/Service #Market and Competitor Analysis #Diagram
