Market and Competitor Analysis
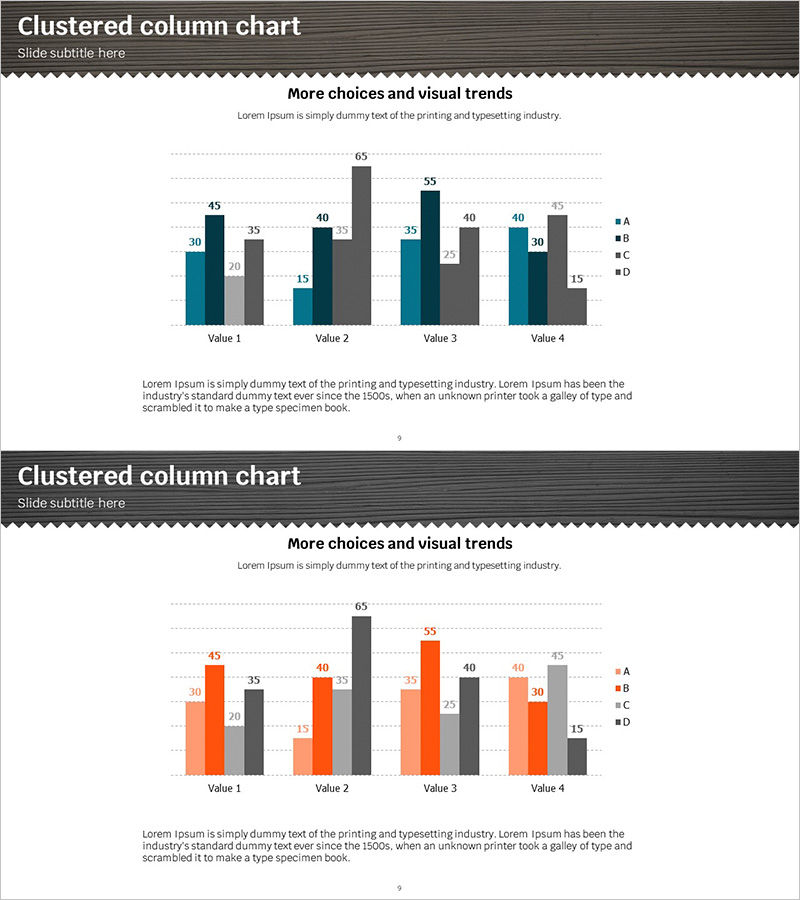
Clustered Vertical Bar Graph for Market Analysis – Data Insights
RJ0300050_8
- Last Update 12/21/2025
- File Size 0.7MB
- # of Slides 2
- File Format PPTX
- Slide Ratio 16:9
- Color
Keywords
About the Product
This slide utilizes a clustered vertical bar graph to effectively visualize market and competitor analysis data. The harmonious color scheme of teal and orange provides a professional feel, allowing for clear comparisons of each value. The distinct separation between the title area and the data area facilitates audience understanding. This template is suitable for various business contexts such as reports, proposals, and presentations, especially when presenting market research or competitor data. With easy text and data field replacements, the editing difficulty is rated as 'easy'.
Related Products
-
Direction of Fintech Business Promotion – Clearly Illustrated with Linear Flow
#Product/Service #Business Promotion Strategy #Diagram
-
Visualize Market Analysis with Comparison Orange Bar Chart - Identify Competitive Edge
#Market and Competitor Analysis #Graph #Competitor Analysis
-
Four Color Infographic – Business Status Presentation
#Product/Service #Business Introduction #Graph
-
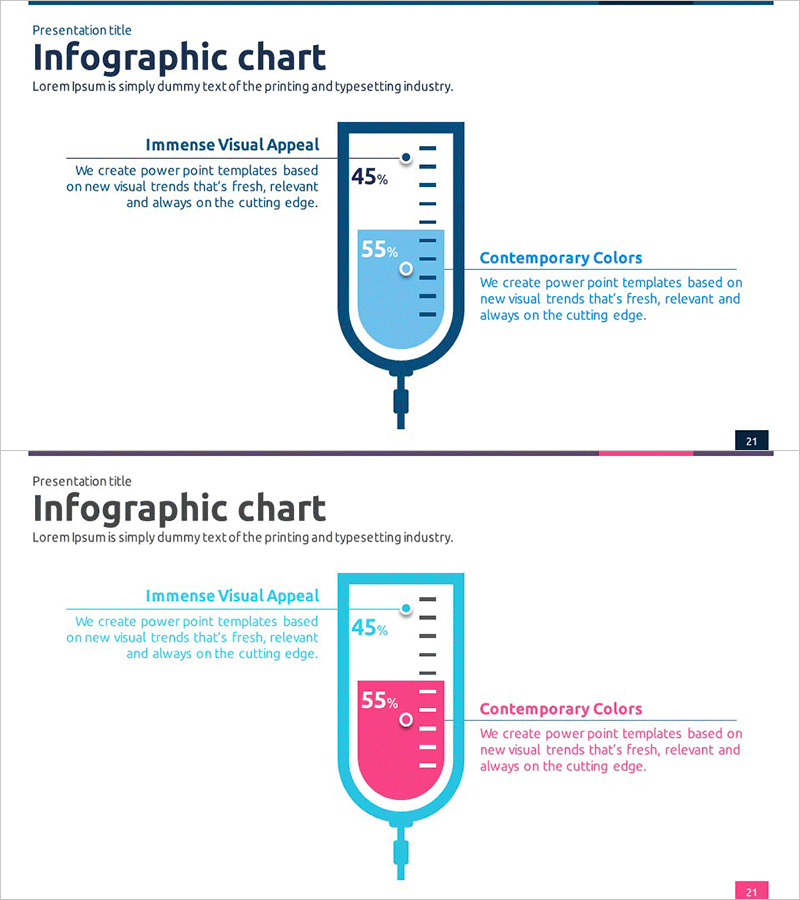
Ringer Shape Subdivided Column Graph – Emphasizing Features and Color Appeal
#Product/Service #Graph #Features
