Ringer Shape Subdivided Column Graph – Emphasizing Features and Color Appeal
RJ0400012_20
- Last Update 05/20/2025
- File Size 1.7MB
- # of Slides 2
- File Format PPTX
- Slide Ratio 16:9
- Color
Keywords
About the Product
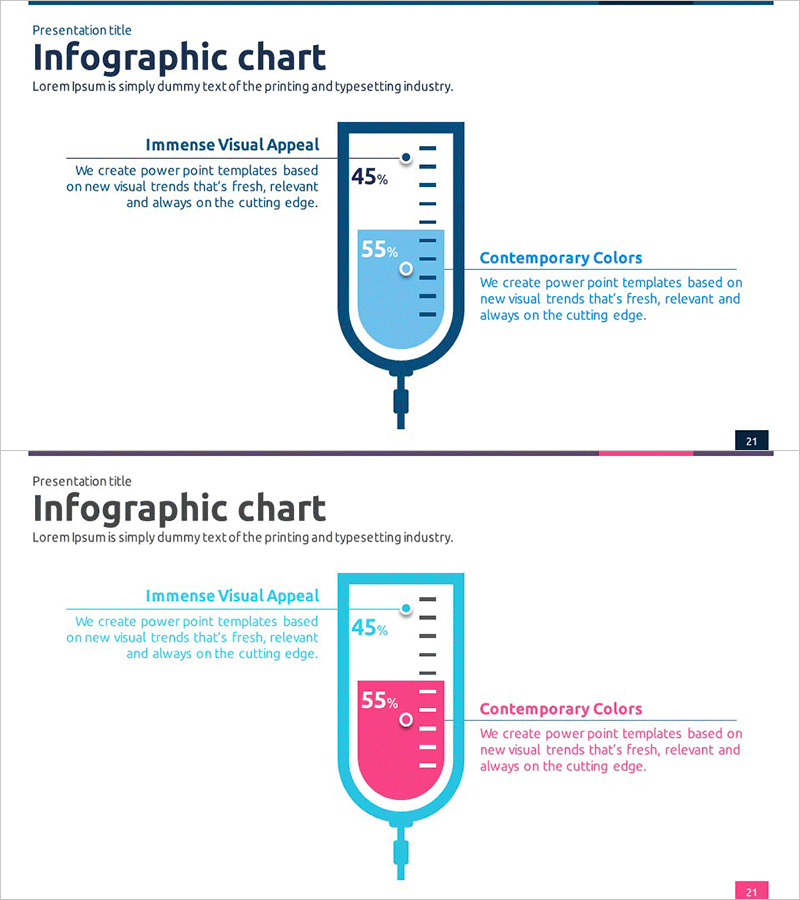
A unique subdivided vertical column chart in the shape of a syringe (ringer) for PowerPoint presentations. This slide visually represents two data ratios—45% and 55%—with a gradient effect transitioning from dark blue to light blue, emphasizing data contrast. The 2-slide set includes color variations (blue and pink) suitable for product features, market share, ingredient ratios, and comparative data presentations. Text areas are strategically positioned to allow seamless infographic-style explanations alongside the chart.
Usage Points
-
Main Usage
Designed to compare two key data points side-by-side, such as product ingredient ratios, market share percentages, or feature comparisons. The distinctive syringe shape captures audience attention while conveying numerical data intuitively and memorably.
-
How to Use
Insert this slide in product introduction sections to display ingredient or feature ratios. Ideal for marketing presentations, product planning reports, and market analysis documents. Add descriptive text in the designated areas to provide context and enhance clarity of the data being presented.
-
Recommended For
Recommended for product marketing managers, market analysts, and sales presentation specialists. Particularly effective in pharmaceutical, cosmetics, food, and beverage industries when explaining ingredient or efficacy ratios. Also suitable for technical planning documents and business report data visualization sections.
-
Slide Structure
Two-slide set with color variations: first slide features dark blue to light blue gradient, second slide offers light blue to pink gradient. Each slide includes a ringer-shaped vertical column chart (marked 45% and 55%) with left and right text areas for annotations. Optimized for 16:9 widescreen format with professional spacing and alignment.
Related Products
-

Astronomy Analysis Detailed Graph – Visualizing the Universe through Data
#Product/Service Introduction #Market and Competitor Analysis #Graph
-

Precautions for Driving Presentation Template – Safety Focused Design
#Slide Type #Product/Service Introduction #Features
-

Work Life Icons Enhancing Slide Template
#Product/Service Introduction #Business Introduction #Diagram
-

Detailed Guidance by Part Slide Template – Efficient Operational Planning
#Product/Service Introduction #Operational Plan #Diagram
