Product/Service
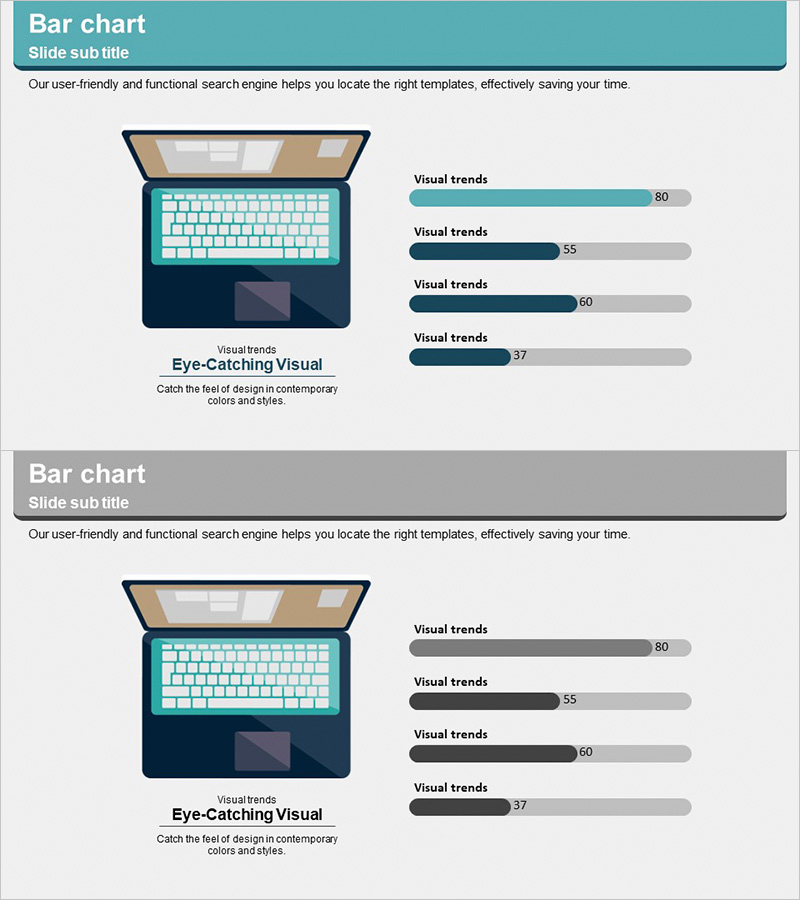
Notebook Configuration Analysis Graph – The Optimal Choice for Organizing Data
RJ0300045_23
- Last Update 12/21/2025
- File Size 0.8MB
- # of Slides 2
- File Format PPTX
- Slide Ratio 16:9
- Color
Keywords
About the Product
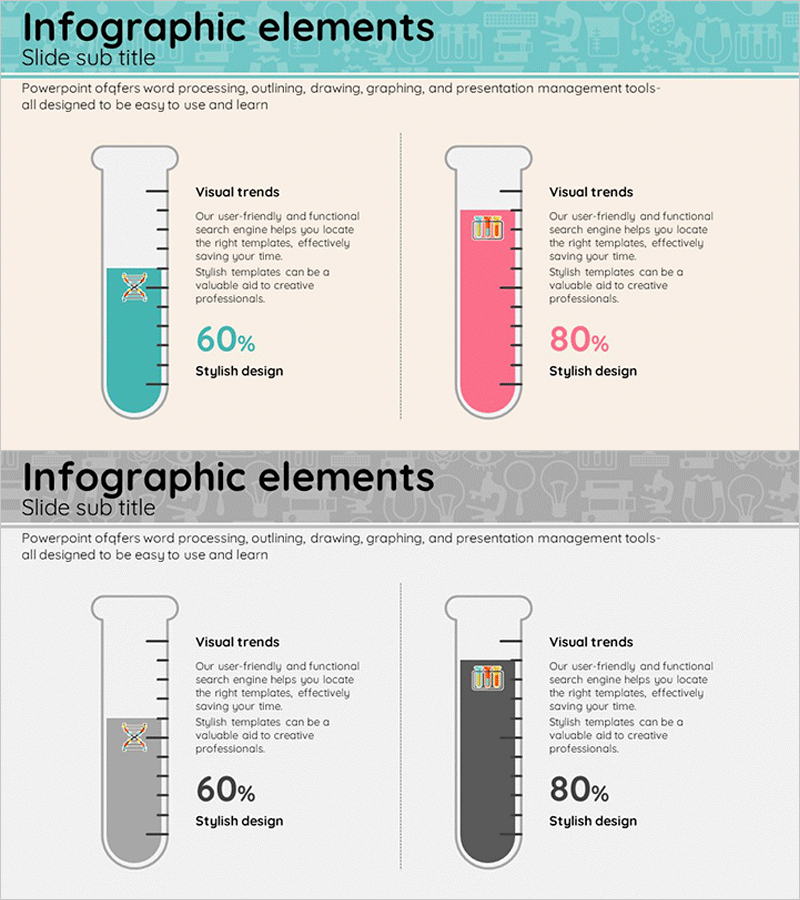
This slide features a bar chart for analyzing the configuration of a notebook. With a simple yet intuitive layout, it effectively conveys information, using turquoise and gray to provide visual stability and professionalism. Ideal for presentations outlining products or services, as well as development plans, this tool captures the audience's attention through effective data visualization. Text and graph replacements are easy, and the editing difficulty is rated as 'easy', making it suitable for a variety of presentation materials.
Related Products
-
Slide Visualizing Data with Simple Mat Lab Graph
#Graph
-
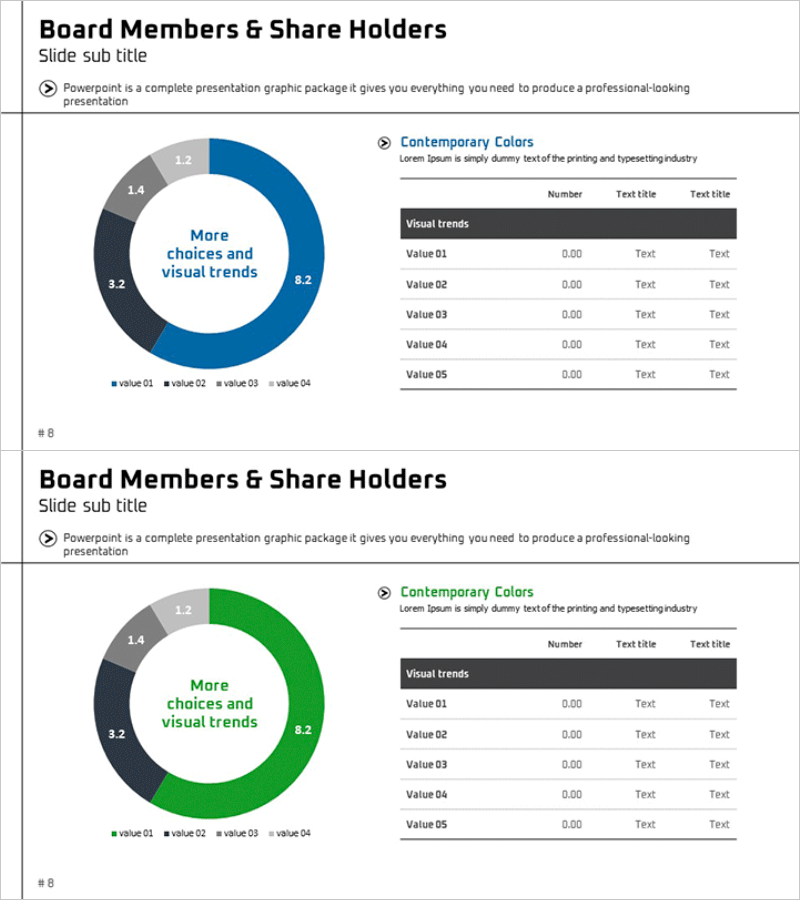
Shareholder Status Analysis Donut Chart – Insights and Analysis
#Company Introduction #Market and Competitor Analysis #Diagram
-
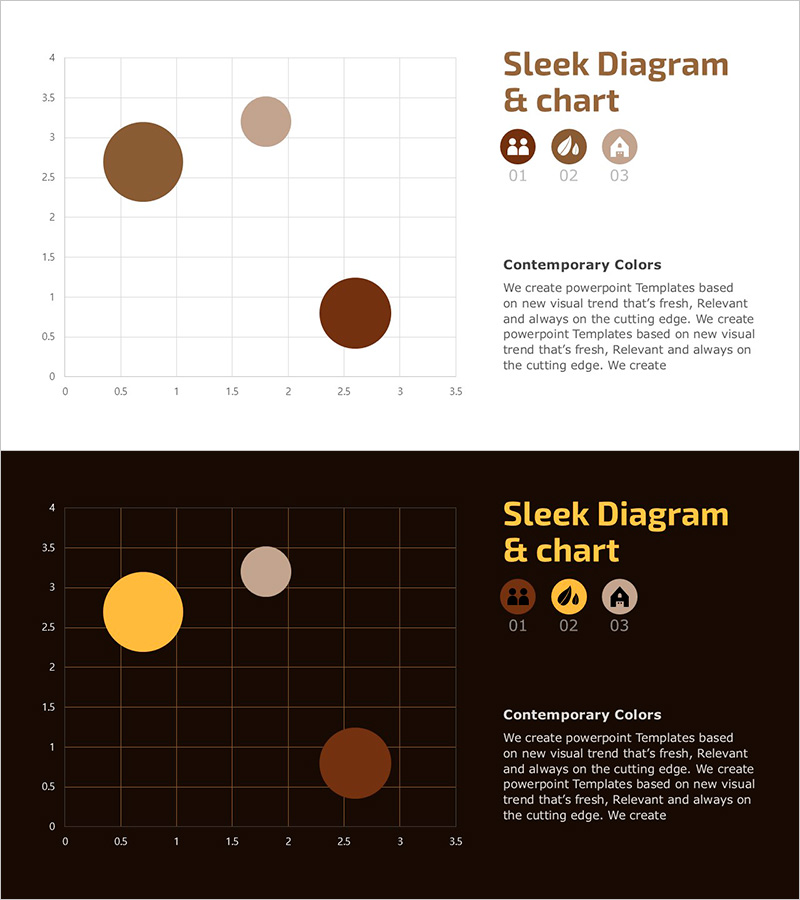
Subdivision Graph for Market Analysis – Competitor Insights
#Market and Competitor Analysis #Graph #Competitor Analysis
-
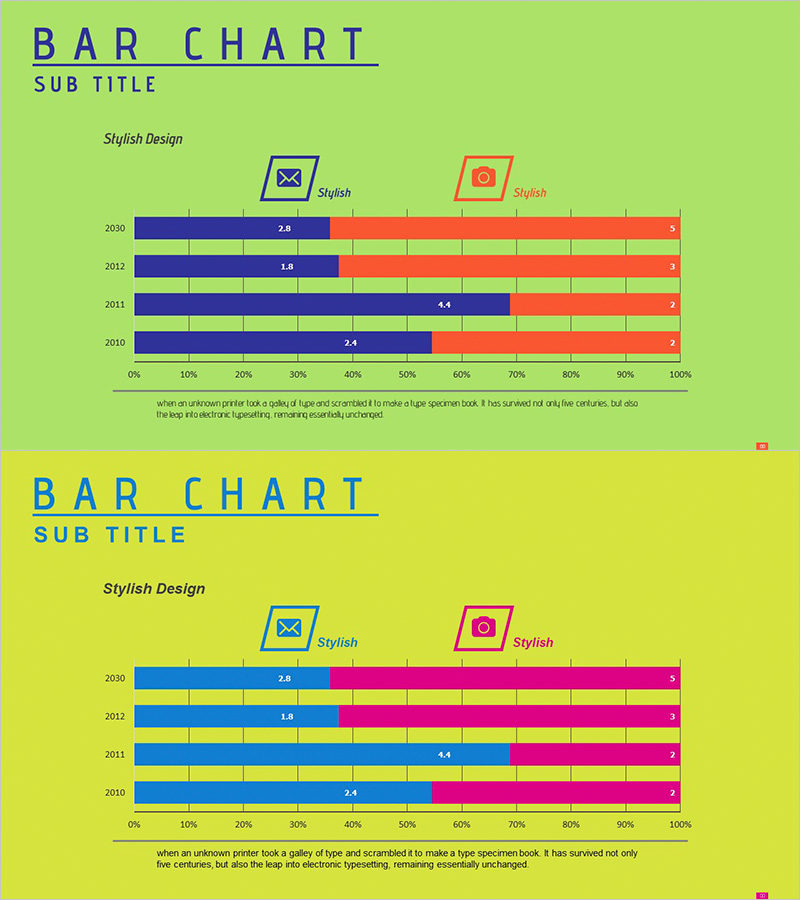
Laboratory Beaker Shape Comparison Graph
#Market and Competitor Analysis #Graph #Competitor Analysis
