Graph of Transportation Service Usage Status – Market and Competitor Analysis
RJ0300030_19
- Last Update 04/26/2025
- File Size 8.1MB
- # of Slides 2
- File Format PPTX
- Slide Ratio 16:9
- Color
Keywords
- #Content-Based Slides
- #Design-Based Slides
- #Product/Service Introduction
- #Market and Competitor Analysis
- #Graph
- #Development Status
- #Market Share
- #Circles
- #Doughnut Chart
- #16:9
- #doughnut chart PowerPoint
- #pie chart slide template
- #ratio comparison chart
- #market analysis graph
- #competitor analysis PowerPoint
- #donut chart download
About the Product
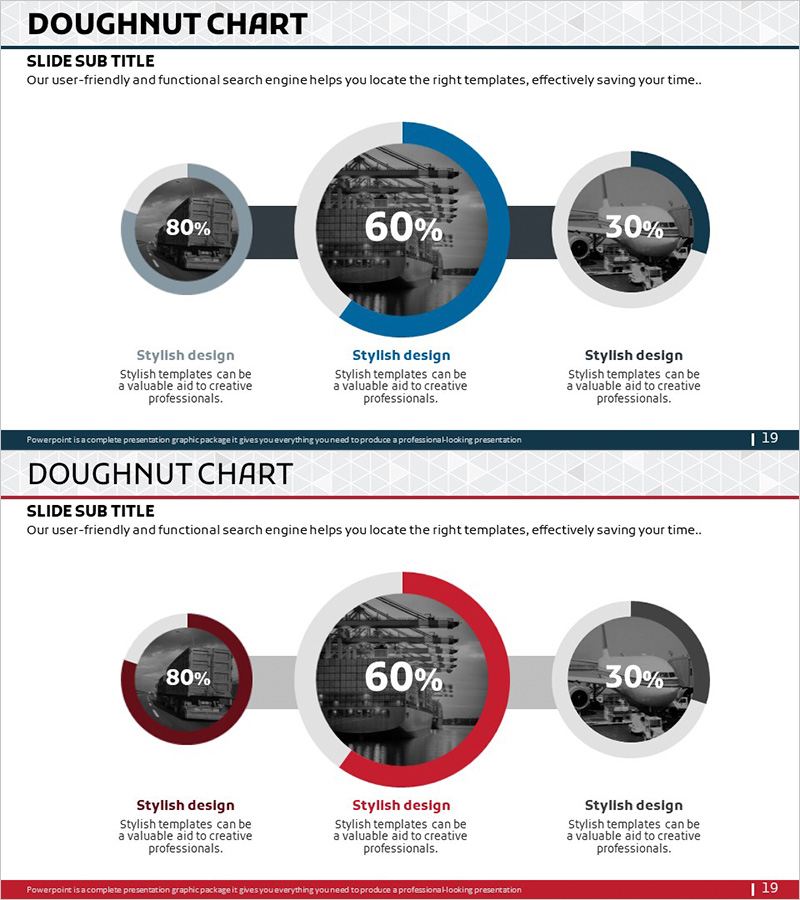
A doughnut chart PowerPoint slide visualizing transportation service usage patterns and market analysis. The design features a central donut-shaped circle displaying the primary metric, flanked by two auxiliary circular segments on the left and right, each representing comparative data points. The color scheme combines blue, red, and gray tones to emphasize key segments, with integrated background imagery and transparency effects to provide data context. This slide template is optimized for presenting ratio-based information such as market share, competitor benchmarking, and service adoption rates. The 2-slide set offers multiple color theme variations and is fully editable in PPTX format for immediate customization.
Usage Points
-
Main Usage
Presents usage statistics, market share, and competitive positioning in transportation, logistics, and service industries using circular ratio visualization. The central donut area anchors the primary metric while surrounding segments display supporting data in parallel, enabling multi-layered information comprehension at a glance.
-
How to Use
Insert into business plans, marketing proposals, and investor pitch decks within market analysis or competitive landscape sections. Edit text and numerical values by double-clicking directly on the chart elements. Modify colors via the Design tab theme options. Background imagery can be removed or replaced as needed.
-
Recommended For
Transportation and logistics professionals, marketing strategists, business development managers, and investor relations teams presenting market size, customer distribution, and competitive dynamics with persuasive visual impact.
-
Slide Structure
2-slide set. Each slide contains three data visualization areas: central doughnut ring (60% metric), left circular segment (80% metric), and right circular segment (30% metric). Blue-accent and red-accent color theme variations provided. 16:9 widescreen format, fully editable PPTX.
Related Products
-

City Theme Market Share Graph – Business Data Visualization
#Product/Service Introduction #Market and Competitor Analysis #Graph
-

Business Idea Development Status Graph – Ideas and Growth
#Product/Service Introduction #Market and Competitor Analysis #Graph
-

Analysis of Transportation Usage Status – Pie Chart
#Product/Service Introduction #Market and Competitor Analysis #Graph
-

Doughnut Chart Visualizing Current Status of 3D Printing Technology Development
#Product/Service Introduction #Market and Competitor Analysis #Graph
