Analysis of Product Utilization by Region – Market and Competitor Insights
RJ0300028_20
- Last Update 04/25/2025
- File Size 2.3MB
- # of Slides 2
- File Format PPTX
- Slide Ratio 16:9
- Color
Keywords
About the Product
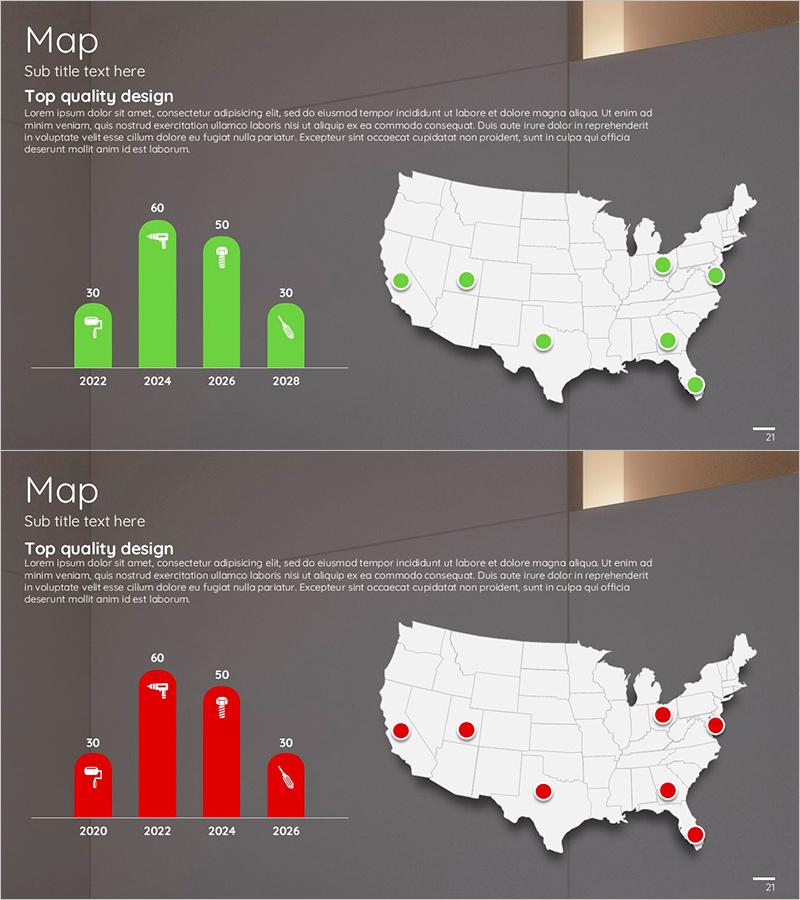
This slide visually analyzes product utilization by region, providing market information. The usage data for each area is displayed graphically, with a color scheme of green and red making the information easily accessible. Ideal for market research, competitiveness analysis, and strategy formulation, this template suits materials and reports related to 'Market and Competitor Analysis'. Users can easily modify text and data, with an editing difficulty rated as 'easy', allowing for swift application in various presentations.
Usage Points
-
Main Usage
- This template serves as a tool for presenting regional market analysis, allowing users to visually communicate product usage trends in different areas. It is particularly useful in situations where stakeholders need to understand regional performance variations for informed decision-making.
-
How to Use
- Users can incorporate this template in strategic meetings, where they need to present market analysis to executives or team members. By modifying the pre-existing data, they can quickly adapt the content to suit various reports or presentations.
-
Recommended For
- This template is ideal for marketing professionals, business analysts, and strategists who require a clear visual representation of market data. It is particularly beneficial for those preparing reports for internal reviews or client presentations that demand a comprehensive understanding of market dynamics.
-
Slide Structure
- The presentation consists of multiple slides, each tailored to highlight specific areas of market utilization, starting from an overview and progressing to detailed regional insights. This structure facilitates a logical flow that allows audiences to grasp complex data easily.
Related Products
-

Analysis of Global Target Regional Distribution Slide
#Company Introduction #Market and Competitor Analysis #Graph
-

Global User Status Analysis Graph – Data Visualization
#Market and Competitor Analysis #Graph #Other
-

Horizontal Bar Chart Visualizing US Target Market Progress
#Market and Competitor Analysis #Graph #Other
-

Target Market Analysis Data Table - Market Growth Statistics
#Market and Competitor Analysis #Graph #Other
