Pie Chart by Area – Business Performance Visualization
RJ0300027_19
- Last Update 04/25/2025
- File Size 0.4MB
- # of Slides 2
- File Format PPTX
- Slide Ratio 16:9
- Color
Keywords
About the Product
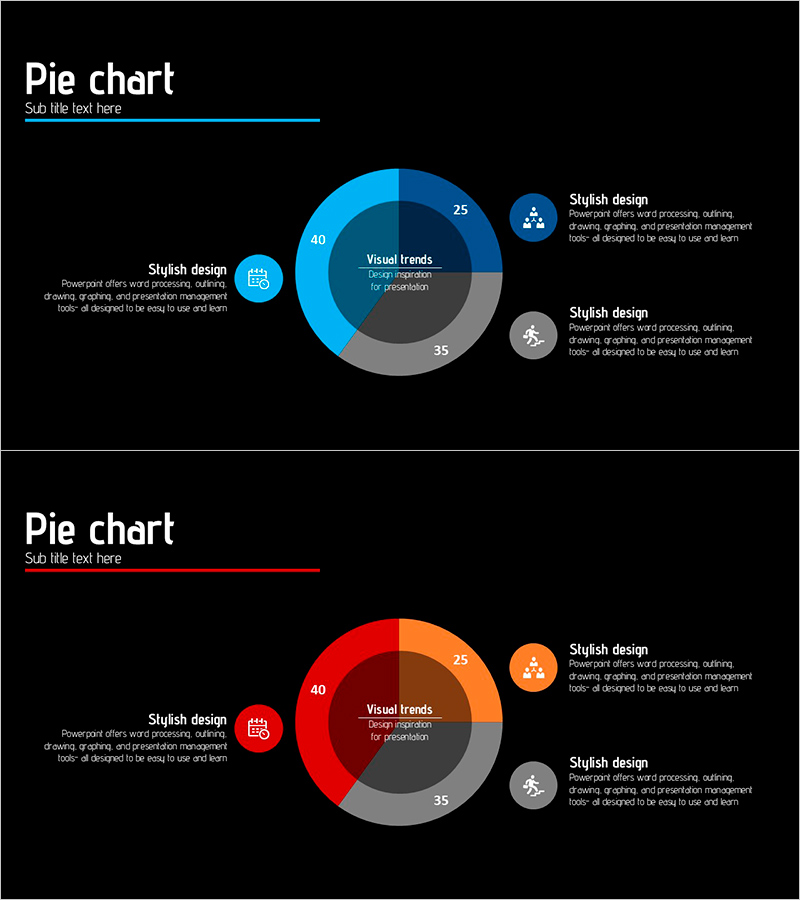
A PowerPoint pie chart slide that visualizes business performance across three segments with proportional data representation. The donut-style pie chart displays 25, 40, and 35 ratio values in the center, with icons and descriptive text boxes positioned on both left and right sides. Set against a black background, the chart uses cyan, orange, and gray color segments to distinguish data categories, with clear numerical labels and legends for each section. This presentation slide is ready for immediate use in business strategy reporting, performance analysis, market share breakdown, customer satisfaction metrics, and other ratio-based data communication.
Usage Points
-
Main Usage
Clearly express the proportion of each item relative to the whole—such as business performance, market share, customer satisfaction, or budget allocation—and communicate data composition intuitively to your audience through visual representation.
-
How to Use
Replace the pie chart values in the center with your actual data, and edit the left and right text box descriptions to match your presentation context. Icons can be swapped to represent different categories, and the color scheme can be adjusted to align with your corporate brand guidelines.
-
Recommended For
Executive presentations reporting performance analysis during business strategy planning, marketing team market analysis presentations, finance department budget allocation explanations, and sales team customer satisfaction analysis reports.
-
Slide Structure
Black background with title area in upper left, 3-segment donut pie chart (25:40:35 ratio) in center, and three icon-text description boxes positioned at lower left and upper-right and lower-right. Provided in 16:9 widescreen format with 2 slides: first in cyan tone variant, second in orange tone variant for flexible color options.
Related Products
-

Camping Business Competitor Analysis Pie Chart
#Business Strategy #Market and Competitor Analysis #Graph
-

Diagram of East, West, North, and South for Business Strategy Visualization – A Creative Approach
#Business Strategy #Market and Competitor Analysis #Diagram
-

Sea Life Pi Type Chart – Market Share Analysis
#Business Strategy #Market and Competitor Analysis #Graph
-

Energy Saving Practice Rate Survey Pie Chart
#Business Strategy #Market and Competitor Analysis #Graph
