Service Composition Diagram Circular Diagram – Clustering and Connection
RJ0300026_27
- Last Update 04/24/2025
- File Size 0.3MB
- # of Slides 2
- File Format PPTX
- Slide Ratio 16:9
- Color
Keywords
- #Content-Based Slides
- #Design-Based Slides
- #Product/Service Introduction
- #Technical Approach
- #Diagram
- #Composition
- #Service Architecture Diagram
- #Cluster
- #Closed Cluster Diagram
- #Chain Diagram
- #16:9
- #circular diagram PowerPoint
- #cluster diagram slide template
- #service architecture diagram
- #4-stage process diagram
- #business process visualization PowerPoint
About the Product
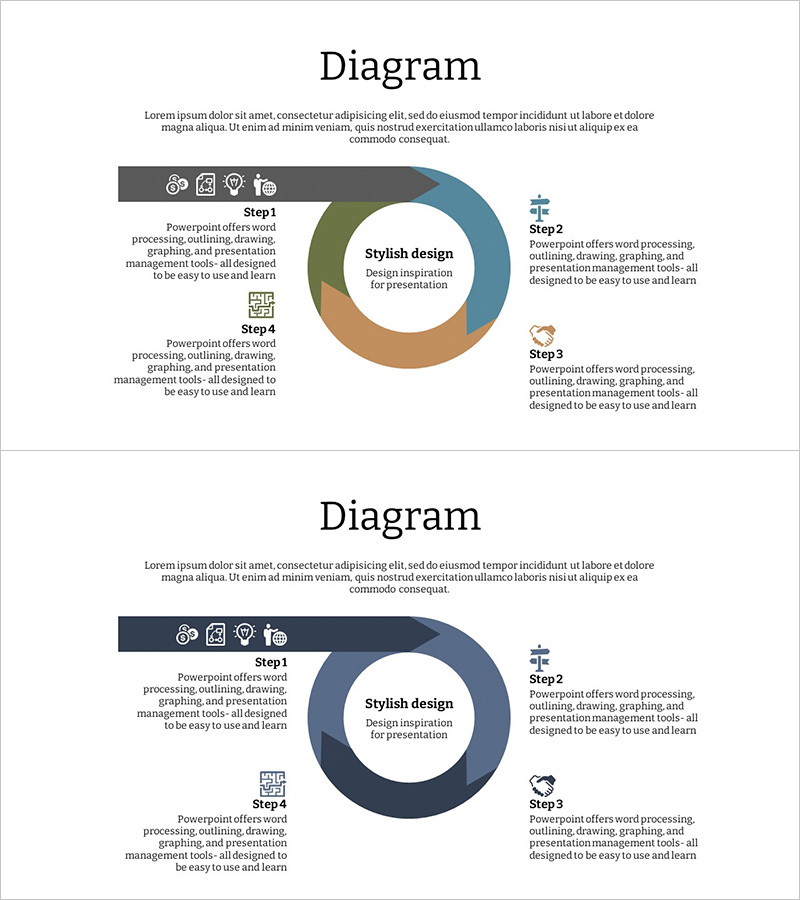
A 4-stage circular cluster diagram PowerPoint slide designed to visualize service architecture and system composition. The diagram features a central concept surrounded by four curved segments in warm tones—khaki, teal, tan, and gray—creating a balanced, interconnected structure. Each segment includes space for descriptive text and icons, making it ideal for presenting service flows, technical architecture, organizational relationships, and process hierarchies. The 2-slide set provides layout variations to maintain consistent design throughout your presentation while allowing flexibility in content arrangement.
Usage Points
-
Main Usage
Effectively communicates hierarchical relationships and cyclical processes in a balanced, visually organized format. The central hub anchors the core concept while four symmetrical segments present supporting information, making complex technical or organizational structures immediately understandable to your audience.
-
How to Use
Enter your main topic in the central circle, then populate each of the four curved segments with stage-specific content, roles, or functions. Customize the provided icons or replace them with your own to emphasize each segment's purpose. Adjust colors to align with your brand guidelines while maintaining the diagram's structural integrity.
-
Recommended For
Ideal for technology teams, IT planners, and business strategists presenting service compositions, system architectures, and organizational structures. Suitable for investor presentations, product launch decks, internal training materials, and strategic planning documents where complex relationships need clear visual representation.
-
Slide Structure
Two-slide layout featuring a central circular hub with four curved cluster segments. Each segment contains dedicated areas for title text, descriptive content, and icon placement. Color scheme includes khaki, teal, tan, and gray tones applied across both slides with consistent proportions.
Related Products
-

Tree-Shaped Component Diagram Presentation Slide – Diagram-Based Service Introduction
#Product/Service Introduction #Diagram #Features
-

Global Service Operation Diagram – Effective Business Connections
#Product/Service Introduction #Technical Approach #Diagram
-

Association Connection Diagram – Technical Service Configuration
#Product/Service Introduction #Technical Approach #Diagram
-

Beer Tree Structure Chart – A New Paradigm of Data Visualization
#Product/Service Introduction #Technical Approach #Diagram
