Sex Ratio Analysis Breakdown Graph – Marketing Strategy and Operations Plan
RJ0300026_16
- Last Update 04/24/2025
- File Size 1.4MB
- # of Slides 2
- File Format PPTX
- Slide Ratio 16:9
- Color
Keywords
- #Content-Based Slides
- #Design-Based Slides
- #Operational Plan
- #Marketing Plan and Strategy
- #Diagram
- #Business Processes
- #Marketing Objectives
- #Cluster
- #Chain Diagram
- #16:9
- #circular process diagram PowerPoint
- #4-step cycle slide template
- #connected diagram presentation
- #marketing strategy PowerPoint slide
- #business process flow diagram
About the Product
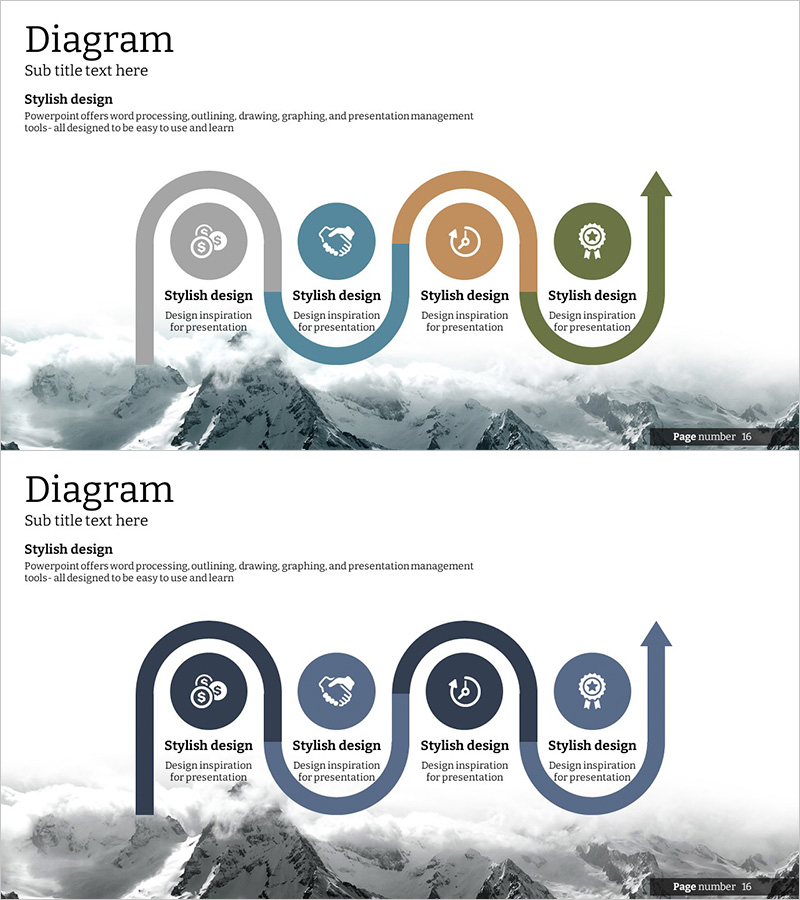
A 4-step circular process diagram PowerPoint slide designed for marketing strategy and operations planning presentations. Four circular nodes in gray, teal, tan, and green tones are connected by directional arrows to visualize continuous workflow cycles. Each stage includes icon placeholders and text areas for customization, making it ideal for representing marketing plans, operational processes, market segmentation, and business cycles. The minimalist mountain background layout integrates seamlessly into professional presentations and strategic planning decks.
Usage Points
-
Main Usage
Visualizes 4-stage cyclical processes including marketing strategy development, operational workflows, business cycles, and market segmentation analysis. The icon and text areas in each node enable clear communication of stage-specific information and key metrics.
-
How to Use
Enter stage titles and descriptions in each circular node, replace icons to match your process, and adjust colors to align with brand guidelines. The arrow directions emphasize the continuous flow, and all elements are fully editable in PowerPoint.
-
Recommended For
Marketing team strategy presentations, operations planning meetings, business process documentation, market analysis and segmentation reports, executive briefings. Ideal for consulting, planning, marketing, and sales departments.
-
Slide Structure
2-slide set featuring identical 4-node circular layouts with directional arrows. First slide shows standard flow; second emphasizes upward progression with accent arrow. Each node contains icon area and text input field, optimized for 16:9 widescreen format.
Related Products
-

Business Process Connection Diagram – Effective Business Operation Strategy
#Business Strategy #Operational Plan #Diagram
-

Business Process Procedure Diagram – Effective Business Management
#Business Management #Operational Plan #Diagram
-

Visualizing Logistics Business Process with Diagram Slide
#Product/Service Introduction #Operational Plan #Diagram
-

Successful Business Strategy Diagram
#Product/Service Introduction #Operational Plan #Diagram
