Business Areas Introduction & Table Slide - Cluster Design
RJ0300024_6
- Last Update 04/24/2025
- File Size 0.3MB
- # of Slides 2
- File Format PPTX
- Slide Ratio 16:9
- Color
Keywords
- #Content-Based Slides
- #Design-Based Slides
- #Company Introduction
- #Business Introduction
- #Diagram
- #Business Areas
- #Business Overview
- #Cluster
- #Table
- #Closed Cluster Diagram
- #Standard Table
- #16:9
- #table slide PowerPoint
- #data organization template
- #business areas comparison slide
- #information table PPT
- #data layout presentation template
About the Product
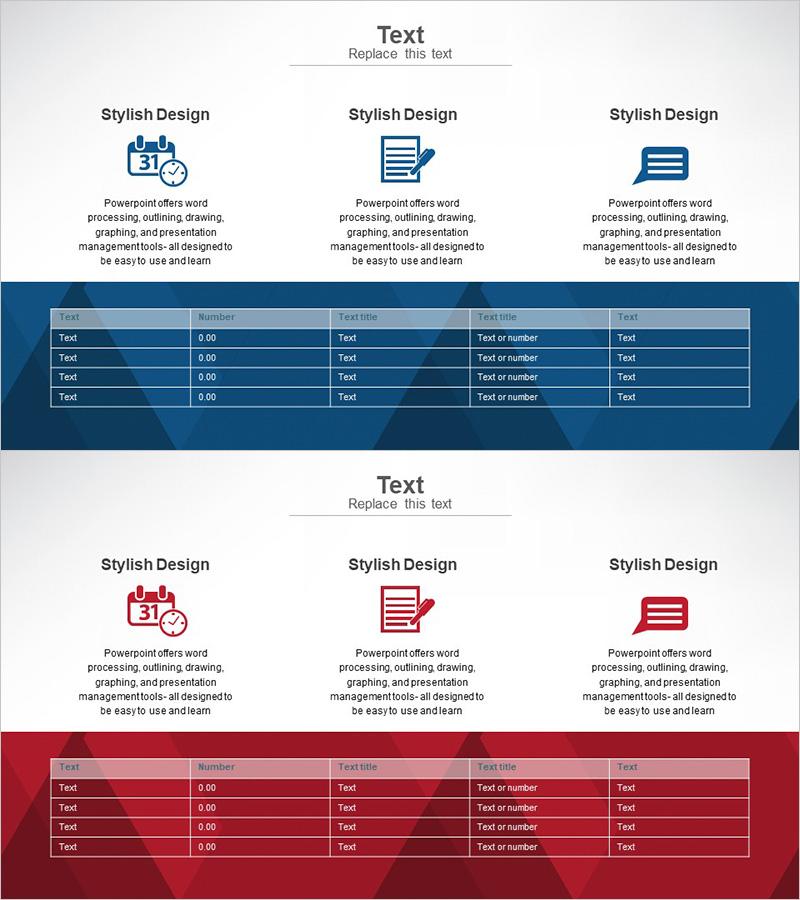
A professional table PowerPoint slide designed to organize business domain information systematically. The 3-column, 4-row structure enables side-by-side comparison of items, numerical values, and descriptions. Dark blue background with white typography ensures optimal data readability, while the top section features 3 icon areas for visual representation of key business divisions. The bottom data table is fully editable, making it ideal for company introductions, business area explanations, product comparisons, and competitive analysis presentations. This PowerPoint slide template is ready to customize and deploy across various business communication scenarios.
Usage Points
-
Main Usage
Ideal for presenting company divisions, product lines, and service categories in a structured tabular format. The combination of icon section and data table allows simultaneous delivery of qualitative descriptions and quantitative metrics, creating a comprehensive business overview.
-
How to Use
Enter business division names and descriptions in the top 3 icon areas, then populate each table cell with item names, numerical values, and detailed information. The dark blue header row and light blue data rows create clear visual hierarchy, directing audience attention during presentations.
-
Recommended For
Executive reports, company introduction presentations, business plans, investor pitch decks, product portfolio overviews, departmental performance comparisons, and market analysis slides. Particularly effective when presenting both quantitative data and qualitative insights in business contexts.
-
Slide Structure
Two-slide set with identical layout structure. First slide features dark blue background with 3 icon sections at top and 5-column, 4-row table below (text, number, title, title, text columns). Second slide provides the same layout with red background for section differentiation or emphasis purposes.
Related Products
-

Delivering Business Goals with Arrow Target Diagram
#Company Introduction #Business Introduction #Diagram
-

Export Business Transportation Diagram – Efficient Business Planning
#Company Introduction #Business Introduction #Diagram
-

Company Overview & Background Introduction Slides – Foundation of Business
#Company Introduction #Business Introduction #Diagram
-

Table Chart Related to Space Industry – Insights from Market Analysis
#Market and Competitor Analysis #Diagram #Market Analysis
