Gender Wage Gap Analysis Graph – Insights for Market Analysis
RJ0300023_17
- Last Update 04/23/2025
- File Size 1MB
- # of Slides 2
- File Format PPTX
- Slide Ratio 16:9
- Color
Keywords
About the Product
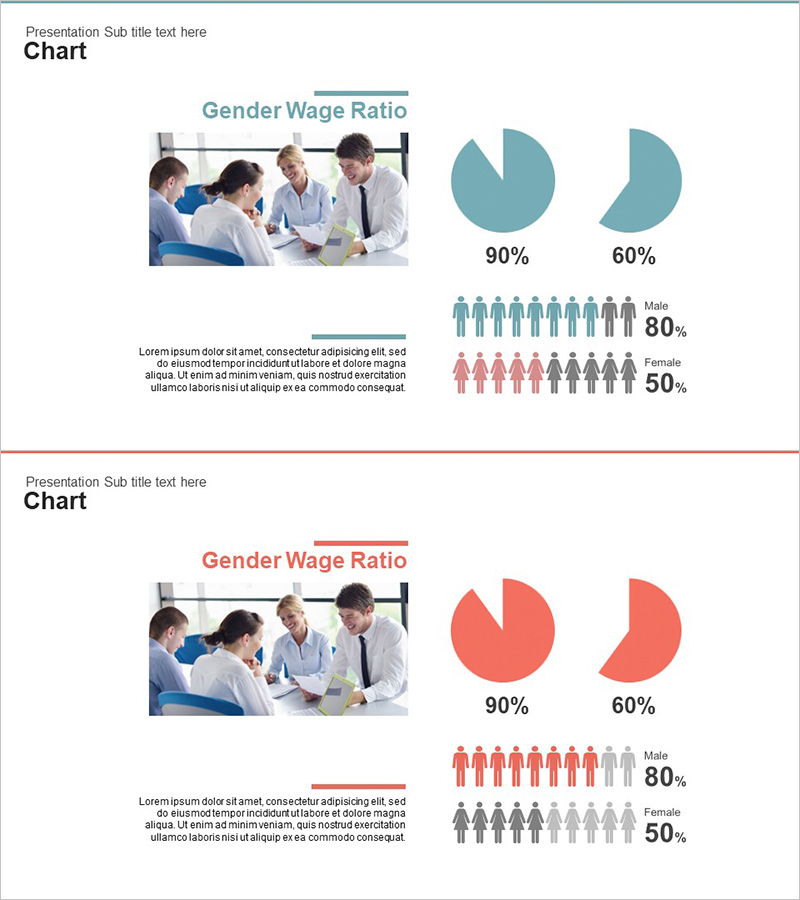
A professional PowerPoint slide deck visualizing gender wage gap data using pie charts and demographic icons. This two-slide set presents dual ratio comparisons (90% and 60%) alongside gender distribution (Male 80%, Female 50%) through intuitive icon representations. The teal and coral color schemes provide clear visual distinction between gender categories, while integrated business meeting imagery and text areas enable immediate use in market analysis, HR policy presentations, and customer demographic reports. Delivered in 16:9 widescreen PPTX format with fully editable elements for seamless customization.
Usage Points
-
Main Usage
Designed to compare and analyze multiple data sets simultaneously—gender wage ratios, workforce composition, and market percentages. The combination of pie charts and demographic icons enables simultaneous presentation of quantitative metrics and qualitative workforce insights.
-
How to Use
Layout features two pie charts positioned above a demographic icon row with accompanying text area. All numerical values, percentages, and color coding are fully editable to match your specific dataset. Icons and charts can be resized or repositioned as needed.
-
Recommended For
HR and compensation professionals presenting wage equity analyses, marketing teams conducting customer demographic breakdowns, C-suite executives delivering market analysis reports, and consulting firms building data-driven business proposals.
-
Slide Structure
Slide 1: Teal pie chart (90%), teal pie chart (60%), 10 male icons (80% indicator), 10 female icons (50% indicator), business meeting photo, text description area. Slide 2: Coral pie chart (90%), coral pie chart (60%), 10 male icons (80% indicator), 10 female icons (50% indicator), business meeting photo, text description area. Total 2 slides, 16:9 aspect ratio.
Related Products
-

Space Industry Analysis Graph Chart – Market and Competitive Analysis
#Market and Competitor Analysis #Graph #Customer Analysis
-

Gender Ratio Customer Analysis 3D Circle Graph – Insights for Market Understanding
#Market and Competitor Analysis #Graph #Other
-

App Payment Service Market Analysis Graph – Visualizing Market Share
#Market and Competitor Analysis #Graph #Market Share
-

Analyzing Chart Results by Item – Understanding the Market and Customers
#Market and Competitor Analysis #Graph #Other
