Internet of Things Service Area Diagram – Business Introduction and Visualization
RJ0400049_14
- Last Update 05/30/2025
- File Size 0.2MB
- # of Slides 2
- File Format PPTX
- Slide Ratio 16:9
- Color
Keywords
- #Content-Based Slides
- #Design-Based Slides
- #Company Introduction
- #Business Introduction
- #Diagram
- #Business Areas
- #Business Areas
- #Cluster
- #Spread
- #Chain Diagram
- #Decentralized Diagram
- #16:9
- #IoT diagram PowerPoint
- #Internet of Things presentation slide
- #4-cluster icon diagram
- #service area visualization
- #business domain classification slide
- #how to create IoT diagram in PowerPoint
About the Product
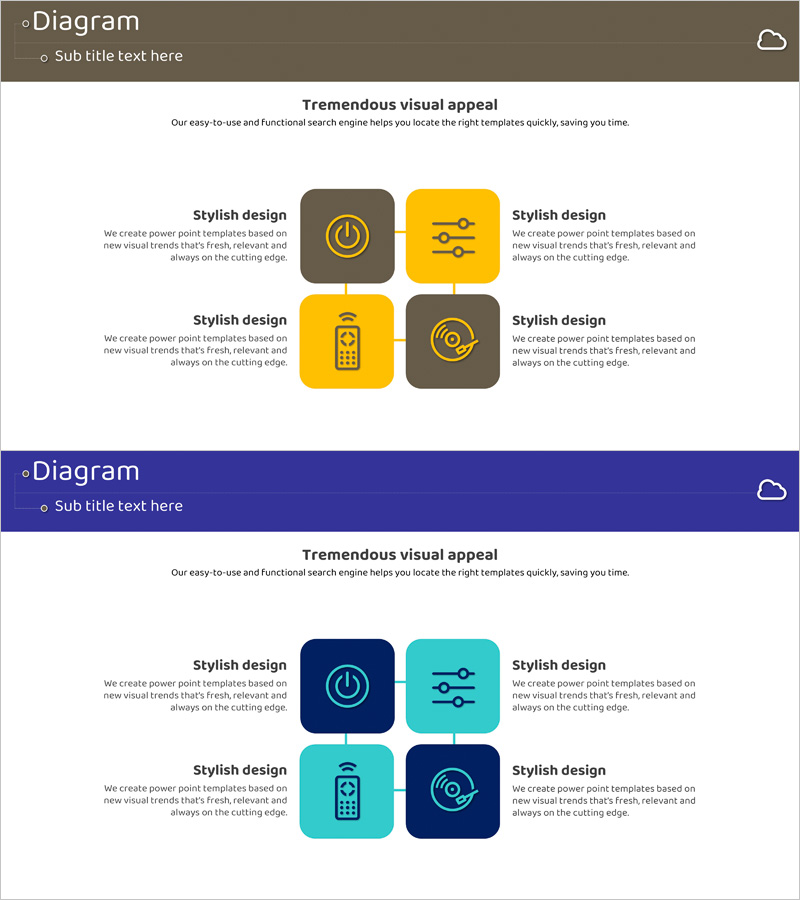
A PowerPoint slide that visualizes Internet of Things (IoT) service areas through four core elements arranged in a balanced, non-centered cluster layout. The diagram features outline icons positioned symmetrically in four quadrants with accompanying descriptive text for each area, making it ideal for business introduction and service domain visualization. The design combines brown and yellow two-tone backgrounds with clean icon graphics, ready to integrate into corporate presentations. Provided in 16:9 widescreen format with 2 slides offering alternative color schemes (brown-yellow and navy-turquoise) for flexible brand customization and easy editing.
Usage Points
-
Main Usage
Clearly communicate the core business domains or service categories of an IoT or digital service company to audiences. The four-icon cluster with descriptive text transforms complex service structures into intuitive visual representations, enabling effective portfolio presentation to executives, investors, and stakeholders.
-
How to Use
Insert into business plans, company profiles, or product introduction presentations within the 'Business Areas' or 'Service Classification' section. Replace placeholder text beside each icon with specific service names and descriptions, and customize background colors to match corporate branding. The outline icons support color changes for seamless integration.
-
Recommended For
Ideal for IoT, smart home, telecommunications, fintech, manufacturing, and energy companies with multiple business domains. Recommended for executive teams, business development, and marketing professionals presenting service portfolios to C-suite executives, investors, and business partners. Suitable for new business domain classification, digital transformation strategy presentations, and service ecosystem introductions.
-
Slide Structure
2-slide set: Slide 1 features brown-yellow two-tone background with 4 icons (power, control, communication, storage) symmetrically positioned in four quadrants, each with 'Stylish design' label and descriptive text area. Slide 2 repeats the same structure with navy-turquoise two-tone background. Both slides include title area at top for customization.
Related Products
-

Pentagonal Star Diagram for Business Introduction and Areas Presentation
#Company Introduction #Business Introduction #Diagram
-

Business Area Connection Diagram – Exploring Business Domains
#Company Introduction #Business Introduction #Diagram
-

Financial Business Triangle Diagram – Visualization of Business Areas
#Company Introduction #Business Introduction #Diagram
-

Company Stock Analysis Diagram – Stylish Design for Presentations
#Company Introduction #Business Introduction #Diagram
