Business Man History Diagram – Record of Growth and Development
RJ0300021_4
- Last Update 04/23/2025
- File Size 5.6MB
- # of Slides 2
- File Format PPTX
- Slide Ratio 16:9
- Color
Keywords
About the Product
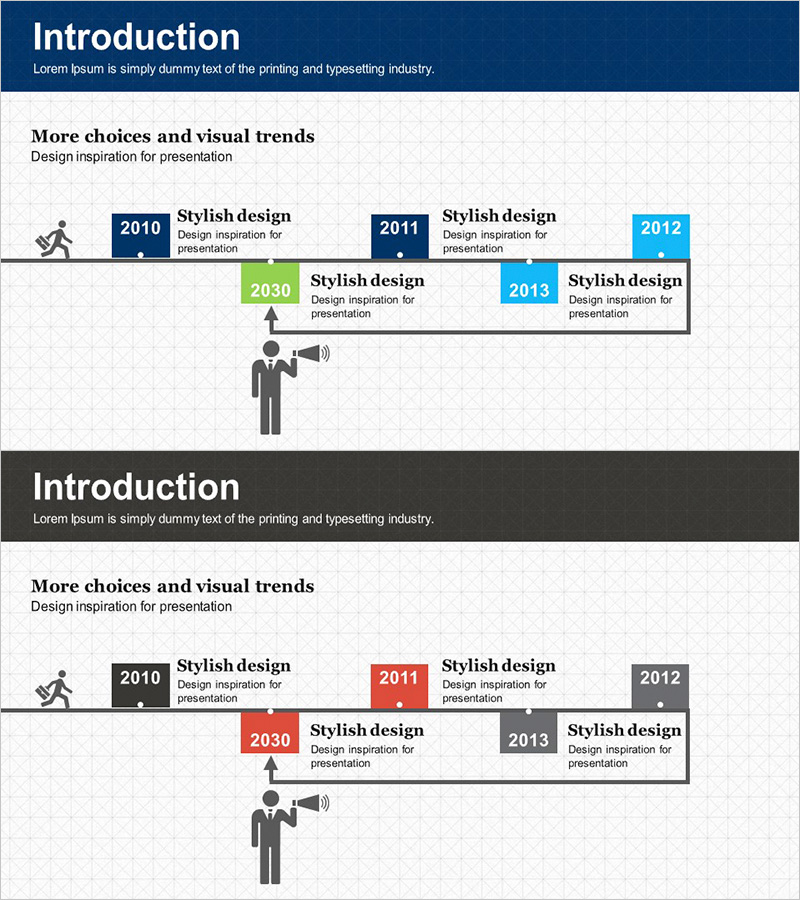
A timeline connection diagram PowerPoint slide that visualizes business growth and company history. This 2-slide presentation template displays a 4-node timeline from 2010 to 2013, with clear directional arrows and connecting lines showing corporate development stages. Features dark blue, green, and cyan year boxes with business person and megaphone icons, making it ideal for company profile presentations, business reports, and investor pitch decks. Provided in 16:9 widescreen PPTX format with fully editable text and colors for immediate use.
Usage Points
-
Main Usage
Designed to present company milestones, business development phases, and project timelines in chronological order. The 4 year-based nodes connected by directional arrows clearly visualize growth trajectory. Perfect for communicating corporate history, product launch schedules, business expansion plans, and strategic development phases.
-
How to Use
Apply to company profile presentations (company history section), business reports (performance summary), investor relations (IR) presentations (corporate growth story), and marketing plans (brand development timeline). Customize each node's year and text to match your organization's or project's specific timeline and milestones.
-
Recommended For
Business executives, marketing managers, business development teams, investor relations professionals, management consultants, and educators who need to present company history, growth trajectory, and project progress in a persuasive and visually clear manner.
-
Slide Structure
2-slide set featuring identical timeline layouts in two color themes (blue and black backgrounds). Each slide contains 4 year boxes (2010, 2011, 2012, 2013) with business person and megaphone icons, connected by lines and directional arrows indicating progression. Optimized for 16:9 widescreen format compatible with modern projectors and digital displays.
Related Products
-

Company History Mini Diagram – Clear and Concise Timeline
#Company Introduction #Diagram #History
-

History Flag Shape Diagram - Company Growth and Vision
#Company Introduction #Diagram #History
-

Business History Connection Diagram
#Company Introduction #Diagram #History
-

Introduction to the History of the Architectural Company – A Visual Timeline
#Company Introduction #Diagram #Company Overview
