Introduction to Service Development Plan – Circular Flow Diagram
RJ0300018_18
- Last Update 04/22/2025
- File Size 2.9MB
- # of Slides 2
- File Format PPTX
- Slide Ratio 16:9
- Color
Keywords
About the Product
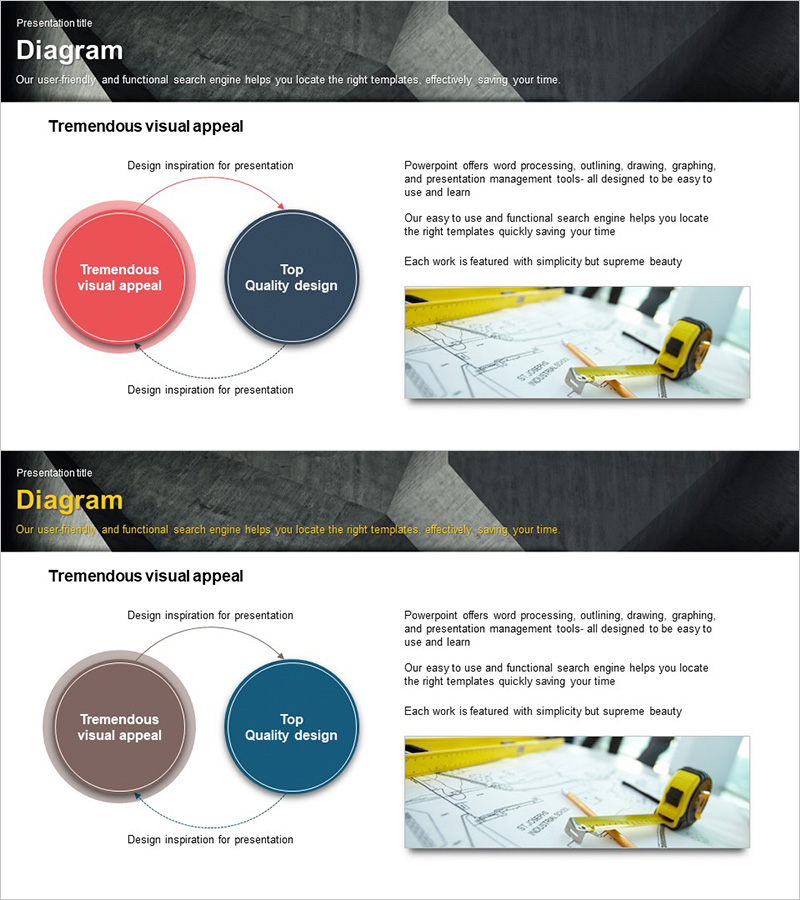
A PowerPoint slide template that visualizes service development plans using a bidirectional circular flow diagram. Two circular nodes in red and navy blue are connected by dotted arrows, intuitively showing mutual relationships and cyclical structures. The 2-slide set includes color variations (red & gray, gray & navy) to match your presentation context. Available in 16:9 widescreen PPTX format with fully editable elements, ideal for technology departments, service planning, and process improvement presentations.
Usage Points
-
Main Usage
Optimized for visualizing bidirectional cyclical relationships in service development processes. Clearly expresses mutual interactions, feedback loops, and continuous improvement cycles to enhance audience comprehension.
-
How to Use
Double-click text boxes in the slide master to enter titles and descriptions for each node. Select color variation slides (red & gray or gray & navy) to match your presentation theme. Arrows and nodes can be resized and repositioned using shape editing tools.
-
Recommended For
Recommended for technology teams, service planning departments, and product development teams presenting process explanations. Particularly effective for emphasizing cyclical structures in development strategies, operational improvements, customer feedback loops, and sustainability initiatives.
-
Slide Structure
2-slide set. Slide 1: Two circular nodes (red & navy) with bidirectional dotted arrows and text input areas. Slide 2: Same structure with gray & navy color variation. Each node features gradient effects for 3D visual depth.
Related Products
-

Future Technology System Configuration Diagram – Efficient Development Flow
#Business Management #Technical Approach #Diagram
-

Motor Vehicle Step Diagram – Flow of Technology and Operations
#Operational Plan #Technical Approach #Diagram
-

System Service Development Plan – Circular Diagram
#Technical Approach #Diagram #Service Development Plan
-

Global Network Service Configuration Diagram – Product Differentiation Strategy
#Product/Service Introduction #Technical Approach #Diagram
