Financial Services Development Plan – Effective Diagram Utilization
RM0200004_21
- Last Update 02/02/2025
- File Size 0.3MB
- # of Slides 2
- File Format PPTX
- Slide Ratio 16:9
- Color
Keywords
- #Content-Based Slides
- #Design-Based Slides
- #Technical Approach
- #Diagram
- #Service Development Plan
- #Research and Development
- #Spread
- #Radial Diagram
- #16:9
- #radial diagram PowerPoint slide
- #center expansion presentation template
- #3-item structure diagram
- #financial services development plan PPT
- #concept expansion slide design
About the Product
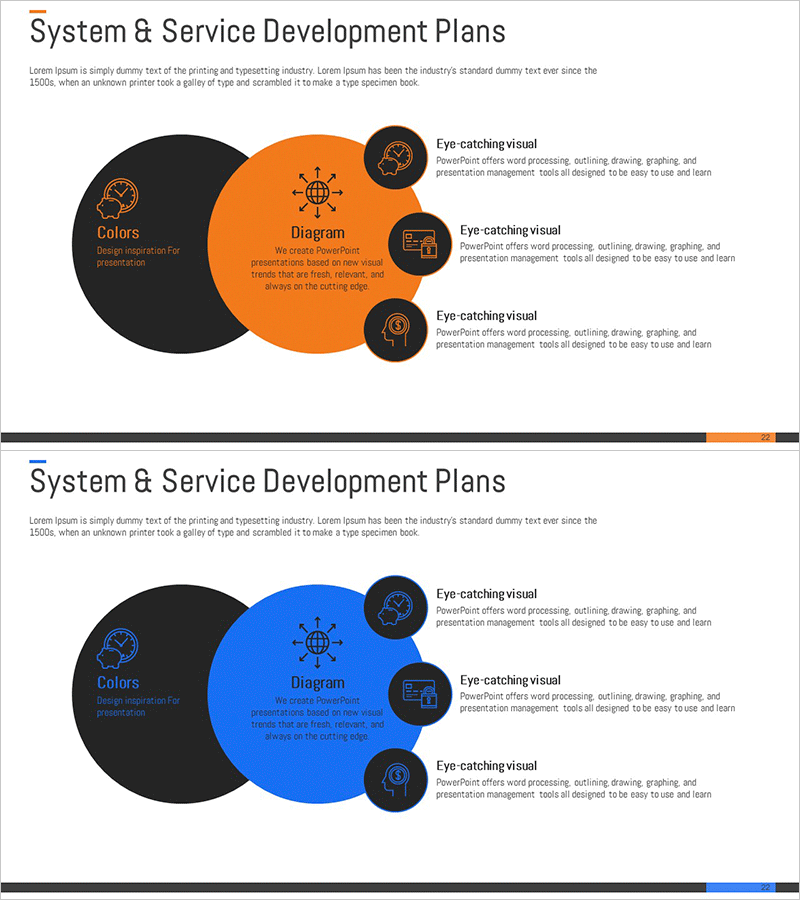
A radial diagram PowerPoint slide that expands from a central concept to three key items, creating a clear visual hierarchy. The design features a black circular center with orange or blue expansion areas, each containing an icon and text description field. This presentation template is ideal for financial services, technology development, and strategic planning documents where you need to communicate core concepts alongside supporting details. The 2-slide set includes color variations in orange and blue, allowing you to match your presentation tone and adapt the design across different sections of your deck.
Usage Points
-
Main Usage
Communicate organizational strategy or development plans by structuring them around a central concept with three supporting elements. Effectively visualizes relationships and emphasizes key components in financial services, system development, and business strategy presentations.
-
How to Use
Enter your core concept in the center circle (e.g., Service Development Plan) and place three main items in the expansion areas (e.g., Technology, Marketing, Operations). Edit the icons and text boxes in each node to add specific content. Switch between orange and blue color versions to apply different tones across presentation sections.
-
Recommended For
Financial and fintech company service development presentations, IT department system development strategy briefings, executive reports on strategic planning phases, consulting firm client proposals, startup investor pitch decks and funding presentations.
-
Slide Structure
2-slide set with identical layouts. Each slide features a black center circle for core concept input and orange or blue expansion areas. Three equally-sized nodes are positioned around the expansion area, each containing an icon placeholder and text description box. Designed in 16:9 widescreen format for modern presentation environments.
Related Products
-

Cluster Diagram Slide for Service Operation Plan
#Technical Approach #Diagram #Service Development Plan
-

Cluster Diagram Slide for Service Development Plan
#Technical Approach #Diagram #Service Development Plan
-

Business Operations Plan Diagram – Visualization for Innovation and Efficiency
#Technical Approach #Diagram #Service Development Plan
-

System Overlap Diagram – Effective Visualization of Service Development Strategies
#Technical Approach #Diagram #Service Development Plan
