Digital Product and Service Introduction – Blue Navy Table Diagram
RJ0300015_8
- Last Update 04/22/2025
- File Size 0.7MB
- # of Slides 2
- File Format PPTX
- Slide Ratio 16:9
- Color
Keywords
About the Product
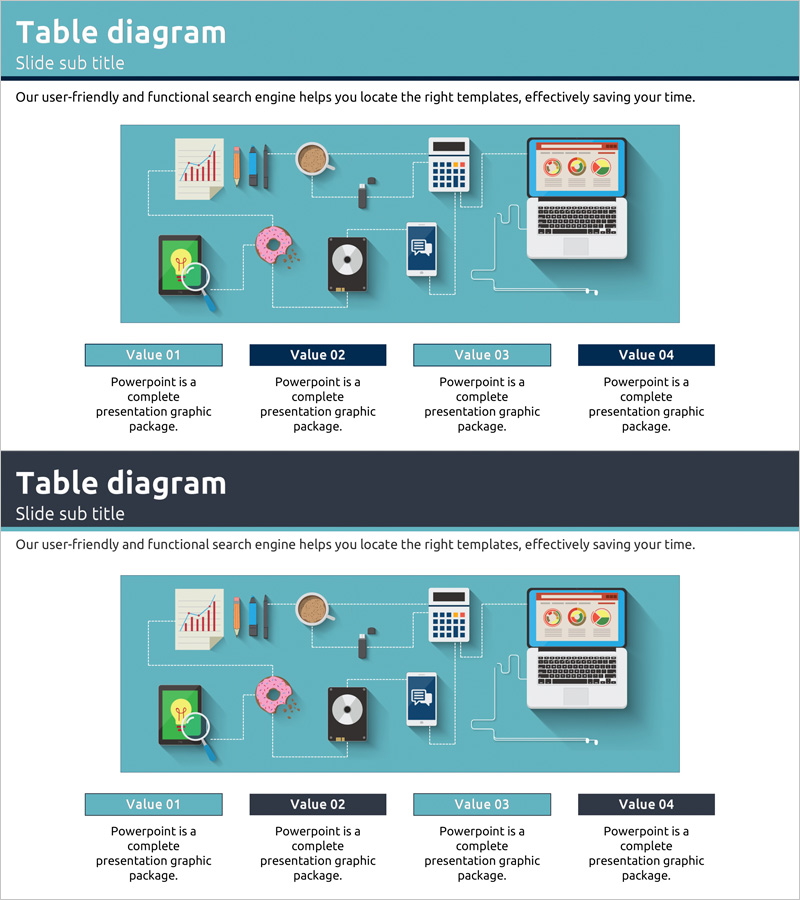
A professional table diagram PowerPoint slide optimized for digital product and service introductions. Features two color variations with turquoise and navy backgrounds, enabling visual comparison and explanation of four key items. The upper section contains an infographic area with icons and connector lines to intuitively express product features, functionality, and system relationships. The lower section displays four value boxes (Value 01–04) for detailed descriptions of each item. Provided in 16:9 widescreen PPTX format, fully editable and ready for immediate use in corporate presentations, product launches, service demonstrations, and stakeholder meetings.
Usage Points
-
Main Usage
Clearly communicate the key features, characteristics, and value propositions of a digital product or service by dividing them into four distinct sections. The upper infographic area visualizes product connectivity and system architecture using icons, while the lower table boxes present detailed explanations for each item, enhancing audience comprehension and engagement.
-
How to Use
Use this slide in product launch presentations, service explanation meetings, investor pitches, and customer demonstrations. Organize your product's core features into four sections in the upper infographic area, then populate the Value boxes below with feature descriptions, benefits, and use cases. The two color variations allow you to maintain visual consistency while adding variety throughout your presentation.
-
Recommended For
IT and software companies, digital service startups, SaaS solution providers, app development firms, digital marketing teams, product managers, sales professionals, and business development executives who need to systematically explain product value and differentiation to stakeholders, investors, and customers.
-
Slide Structure
The slide includes two color variations (turquoise background and navy background), each featuring an upper infographic section with icons, connector lines, and text input areas, plus a lower four-section table area with Value 01–04 boxes containing title and description fields. Two slides total provide matching structure with color variations for document diversity and visual interest.
Related Products
-

Fountain Pen Product Overview – Stylish Design
#Product/Service Introduction #Diagram #Product/Service Introduction
-

Business Program Introduction Slide – Cluster Diagram
#Product/Service Introduction #Diagram #Product/Service Introduction
-

Dot Patterns Wide PowerPoint Template – Product and Service Introduction
#Product/Service Introduction #Text Box #Product/Service Introduction
-

Introducing User-Centric Social Platforms – Vibrant Cluster Design
#Product/Service Introduction #Diagram #Product/Service Introduction
