Monthly Progress Plan Diagram Slide
RJ0300011_7
- Last Update 10/07/2025
- File Size 0.1MB
- # of Slides 2
- File Format PPTX
- Slide Ratio 16:9
- Color
Keywords
- #Content-Based Slides
- #Design-Based Slides
- #Business Strategy
- #Business Management
- #Diagram
- #Implementation Plan
- #Flow
- #Linear Flow
- #Project Progress
- #16:9
- #monthly progress timeline diagram
- #project roadmap PowerPoint slide
- #business schedule presentation
- #6-month timeline template
- #project milestone PowerPoint
About the Product
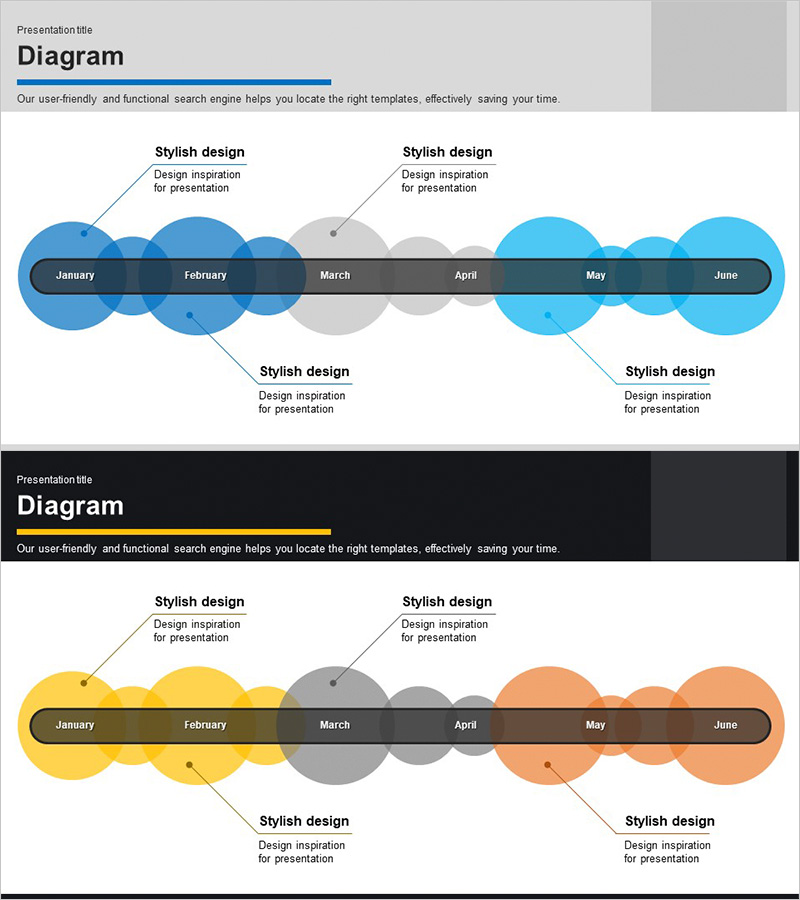
A timeline diagram PowerPoint slide that visualizes business project schedules by month. The design features a horizontal central axis with six circular nodes representing January through June, with connector lines and text areas positioned above and below each node for detailed milestone descriptions. The slide uses three color schemes—blue, gray, and orange—to differentiate monthly progress stages, combining circular nodes with a rectangular axis to convey temporal flow intuitively. Two slide variations with different color palettes are included, allowing you to match your presentation's tone. The PPTX format enables instant editing of monthly labels, descriptions, and colors without design constraints.
Usage Points
-
Main Usage
This slide is designed to clearly communicate monthly project schedules and key milestones in chronological order during business strategy presentations. The timeline format enables stakeholders to grasp project progress at a glance, making it ideal for executive briefings, strategic planning meetings, and business pitch presentations.
-
How to Use
Enter monthly milestones in the central axis nodes and add detailed descriptions in the connector text areas above and below. Customize colors to indicate progress stages (planned, in-progress, completed), or select from the two provided color variations that best match your presentation's visual identity.
-
Recommended For
Recommended for business planning and strategy departments presenting monthly execution schedules, project managers sharing progress updates, executives reporting business status, and investors reviewing project roadmaps. Particularly suitable for mid-term business plans spanning 6 to 12 months.
-
Slide Structure
A horizontal central axis with six circular nodes (January–June) serves as the timeline anchor, with symmetrically positioned connector lines and text input areas above and below each node. Three color schemes—blue, gray, and orange—differentiate monthly stages, with two slide variations providing alternative color palettes.
Related Products
-

Linear Diagram Visualizing Arts and Science Progress
#Business Strategy #Business Management #Diagram
-

Business Plan Linear Diagram – Strategic Flow Visualization
#Business Strategy #Business Management #Diagram
-

Step-by-step Schedule Planning Linear Diagram – Clear Strategic Planning
#Business Strategy #Business Management #Diagram
-

Step-by-step Schedule Arrow Diagram – Visualizing Business Strategy
#Business Strategy #Business Management #Diagram
