Linear Diagram Visualizing Arts and Science Progress
RJ0500031_21
- Last Update 06/15/2025
- File Size 1.7MB
- # of Slides 2
- File Format PPTX
- Slide Ratio 16:9
- Color
Keywords
- #Content-Based Slides
- #Design-Based Slides
- #Business Strategy
- #Business Management
- #Diagram
- #Implementation Plan
- #Flow
- #Linear Flow
- #Project Progress
- #16:9
- #linear diagram PowerPoint
- #business progress slide
- #4-step process diagram
- #PowerPoint slide design
- #how to visualize business progress in PowerPoint
About the Product
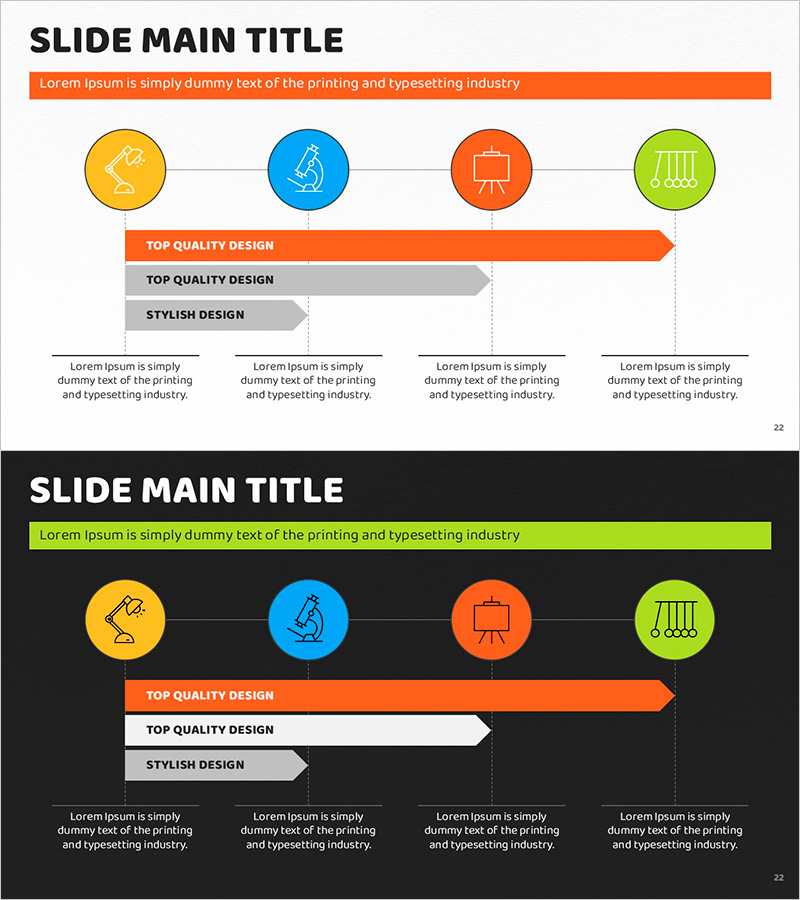
A PowerPoint slide that clearly visualizes business progress through a 4-step linear diagram. Circular icon nodes connected by arrow lines intuitively represent the sequential process, with distinct color coding—yellow, blue, orange, and green—for each stage. Detailed description text areas are positioned below each stage for immediate presentation use. Provided in 2-slide 16:9 PPTX format, this slide is ideal for business management, strategy presentations, progress reports, and stakeholder updates.
Usage Points
-
Main Usage
This slide clearly communicates the sequential stages of business progress using a linear flow diagram. Four circular nodes connected by arrows intuitively represent the progression, with dedicated text areas below each stage for detailed explanations and key information.
-
How to Use
Enter stage titles and descriptions in the text areas below each node. Use this slide in business plans, management reports, and project status presentations to explain progress, timelines, and milestones. The visual flow helps audiences quickly grasp the sequence and current status of initiatives.
-
Recommended For
Recommended for business managers, project leaders, and executives presenting progress updates. Particularly effective for explaining new business launches, organizational changes, and strategic implementations. Suitable for employee training, investor presentations, and client proposal meetings.
-
Slide Structure
Title area at top, 4 circular nodes with icons and connecting arrows in center, and 4 text description areas at bottom. Two design versions provided—light background (top) and dark background (bottom)—for flexible integration with various slide backgrounds.
Related Products
-

Monthly Progress Plan Diagram Slide
#Business Strategy #Business Management #Diagram
-

Business Plan Linear Diagram – Strategic Flow Visualization
#Business Strategy #Business Management #Diagram
-

Facilities and Marketing Management Flow Systems
#Business Strategy #Business Management #Diagram
-

Arrow Pushing Progress Chart - Visualizing Business Strategy
#Business Strategy #Diagram #Flow
