Business Process Circular Diagram – Effective Service Operations
RJ0300011_17
- Last Update 04/21/2025
- File Size 0.1MB
- # of Slides 2
- File Format PPTX
- Slide Ratio 16:9
- Color
Keywords
- #Content-Based Slides
- #Design-Based Slides
- #Operational Plan
- #Technical Approach
- #Diagram
- #Business Processes
- #Service Operation Plan
- #Flow
- #Cluster
- #Linear Flow
- #Chain Diagram
- #16:9
- #circular diagram PowerPoint
- #4-step process slide
- #business workflow PowerPoint
- #cycle diagram template
- #process visualization slide
- #how to create circular diagram in PowerPoint
About the Product
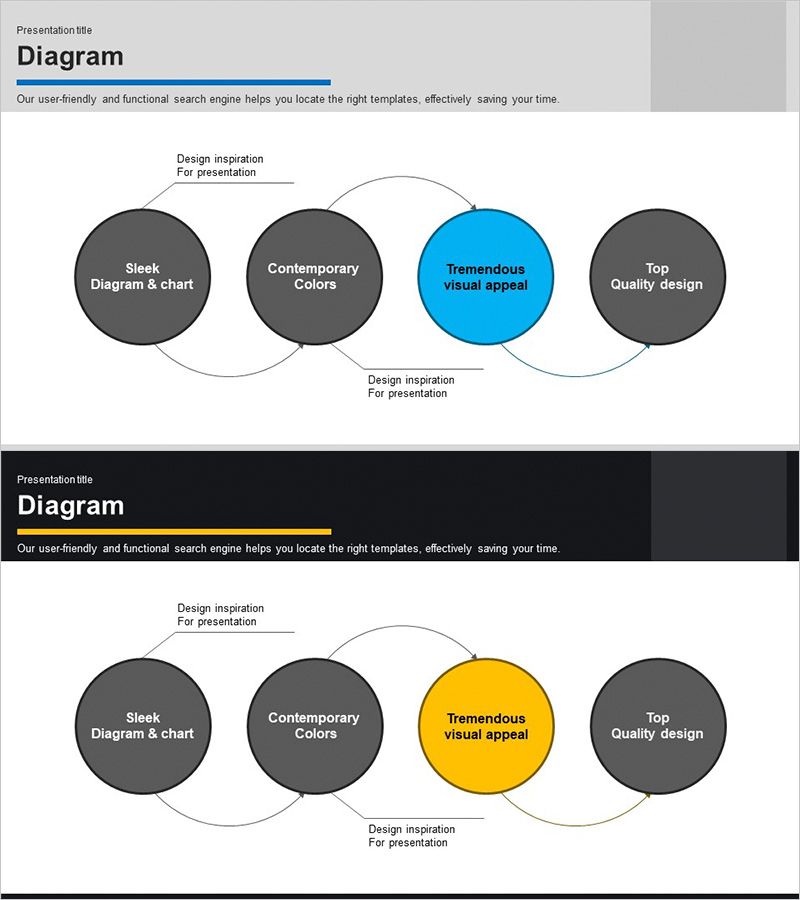
A PowerPoint slide template that visualizes business processes using a 4-node circular diagram structure. Dark gray background nodes with accent colors (blue/yellow) highlight the central focus node, clearly representing sequential flow. Each node includes text input areas, and connecting arrows express the cyclical relationship between stages. This PPT diagram is ready to use for service operations, technical processes, and workflow explanations. The 2-slide set in 16:9 widescreen format can be customized for various presentation scenarios.
Usage Points
-
Main Usage
This diagram is designed to visually represent 4-stage cyclical structures such as business processes, service operation cycles, and technical workflows. It clearly communicates each stage's role and interconnected relationships, enabling both presenters and audiences to intuitively understand the process flow.
-
How to Use
Enter stage names and descriptions in each node's text area. Use blue or yellow accent colors to highlight key stages while keeping other nodes in dark gray to create visual hierarchy. Rearrange node order or modify colors to match your presentation flow.
-
Recommended For
Recommended for technical teams explaining system architecture, operations teams presenting process improvement plans, marketing teams mapping customer journeys, and project managers describing project cycles. Suitable for any business presentation requiring cyclical structure visualization.
-
Slide Structure
2-slide set featuring the first slide with blue accent color and the second with yellow accent color, both displaying identical 4-node circular diagram structures. Each slide contains 4 circular nodes, connecting arrows, and text input areas, optimized for 16:9 widescreen format.
Related Products
-

How to Measure Smart Health – Visualizing Effective Data Flow
#Operational Plan #Technical Approach #Diagram
-

Construction Work Flow System – Efficient Operation Planning and Risk Management
#Operational Plan #Diagram #Business Processes
-

3 Service Operation Methods Using Climbing Ropes
#Operational Plan #Technical Approach #Diagram
-

Design Work Process Diagram – Business Strategy
#Business Strategy #Operational Plan #Diagram
