Curved Theme Purple Template Area Chart & Bar Chart
RJ0200068_27
- Last Update 04/18/2025
- File Size 0.4MB
- # of Slides 2
- File Format PPTX
- Slide Ratio 16:9
- Color
Keywords
About the Product
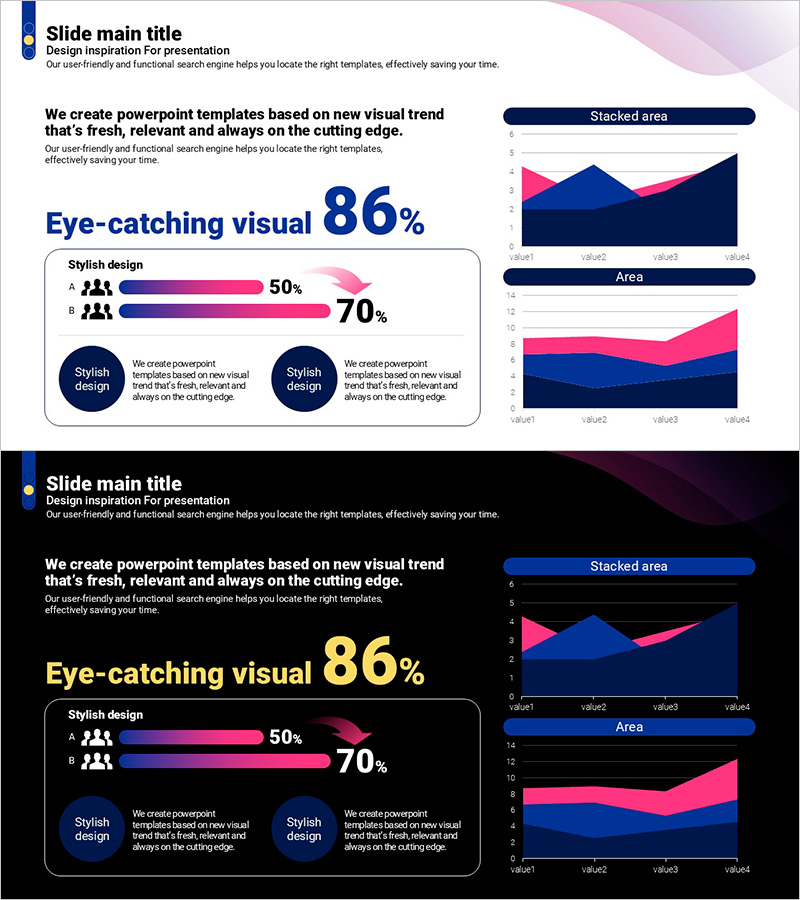
A 2-slide PowerPoint presentation featuring area and bar charts for business performance and market analysis. The slides combine a curved stacked area chart in purple and pink tones with a horizontal bar chart, enabling simultaneous visualization of time-series trends and item-by-item comparisons. Ideal for customer analysis, competitive market analysis, and business overview presentations. Provided in 16:9 widescreen PPTX format with fully editable text and data values for immediate use in professional presentations.
Usage Points
-
Main Usage
Visualize time-series trends and item-by-item comparisons simultaneously through data representation slides. The stacked area chart intuitively displays cumulative data changes over time, while the bar chart clearly compares values across categories. Optimized for expressing complex datasets such as business performance, market size, and customer segment analysis.
-
How to Use
Slide 1 uses a 4-series stacked area chart to represent quarterly or monthly trends. Slide 2 displays a 5-item horizontal bar chart for ranking, ratio, and scale comparisons. Replace legend labels, axis titles, and numerical values with your own data to instantly create presentation-ready materials.
-
Recommended For
Recommended for marketing professionals presenting market analysis, sales teams reporting customer insights, executive-level business performance reviews, and investor presentation decks. Effective for quarterly and annual performance comparisons, regional and customer segment revenue analysis, and competitive market share visualization.
-
Slide Structure
Slide 1: 4-series stacked area chart with purple, pink, lilac, and navy gradient curves, 4 data points, curved boundary lines. Slide 2: 5-item horizontal bar chart with matching color palette, legend display, and numerical labels. Overall design features light pink wave background elements across both slides.
Related Products
-

Triangle Pattern Chart for Market and Competitive Analysis – Customer Segmentation
#Market and Competitor Analysis #Graph #Customer Analysis
-

Rainbow Presentation Template Area Chart – Customer Analysis and Market Trends
#Market and Competitor Analysis #Graph #Other
-

Two-way Chart of Male and Female Surveys – Gender Comparison Visualization
#Market and Competitor Analysis #Graph #Customer Analysis
-

Gender Percentage Visualization of Extreme Sports Activities
#Market and Competitor Analysis #Graph #Other
