Market Analysis at a Glance with Donut Chart – Curved Theme Purple Template
RJ0200068_26
- Last Update 04/18/2025
- File Size 0.7MB
- # of Slides 2
- File Format PPTX
- Slide Ratio 16:9
- Color
Keywords
- #Content-Based Slides
- #Design-Based Slides
- #Market and Competitor Analysis
- #Graph
- #Market Analysis
- #Target Market
- #Circles
- #Doughnut Chart
- #16:9
- #donut chart PowerPoint
- #pie chart presentation slide
- #market analysis template
- #data visualization PowerPoint
- #donut graph slide design
- #competitive analysis presentation
About the Product
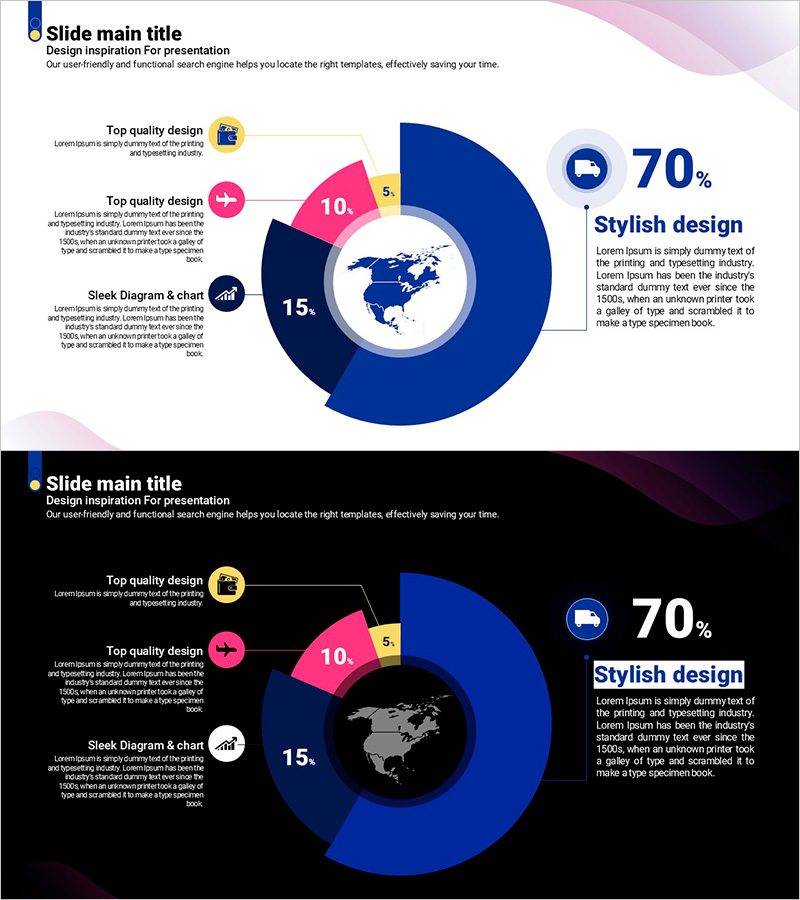
A donut chart PowerPoint slide designed for market analysis and competitive comparison. This presentation template features a 3-segment donut graph with a world map in the center, enabling you to visualize market share, target market proportion, and competitive landscape at a glance. The purple, pink, and navy blue gradient background combined with the circular chart enhances data visualization professionalism. The 2-slide set includes both light and dark background versions, with icons and text descriptions for each segment to strengthen your presentation content. Ready to use as a PowerPoint presentation slide or business deck.
Usage Points
-
Main Usage
Express market share, target market proportion, and competitor share using donut charts for quick comparative analysis. The central world map emphasizes global market scope, while icons and numerical data in each segment clearly communicate specific information.
-
How to Use
Apply this slide to the market analysis section of business plans, marketing proposals, and investor pitch decks. Edit the numerical values and labels in each segment to input your actual data, customize icons and text descriptions to match your presentation context, and select either the light or dark background version based on your presentation environment.
-
Recommended For
Marketing managers, business planners, executives preparing reports, and investor relations professionals explaining market conditions and competitive positioning. Ideal for global business presentations, product launches, and new business proposals where data credibility is essential.
-
Slide Structure
2-slide set featuring one light background slide and one dark background slide. Each slide centers on a 3-segment donut chart with a world map in the middle, icon and text description areas on the left, and key metrics with emphasis message boxes on the right.
Related Products
-

Sugar Usage Analysis Pie & Bar Graph Slide Template
#Market and Competitor Analysis #Graph #Market Analysis
-

Asian Target Market Analysis – Data-Driven Visualization
#Market and Competitor Analysis #Graph #Other
-

Bathroom Demand Survey Graph – Donut Chart for Market Analysis
#Market and Competitor Analysis #Graph #Other
-

Travel Destination Infographic Market Share – Intuitive Data Visualization
#Market and Competitor Analysis #Graph #Market Share
