Curved Theme Purple Template Segmentation Bar Graph
RJ0200068_20
- Last Update 04/18/2025
- File Size 0.6MB
- # of Slides 2
- File Format PPTX
- Slide Ratio 16:9
- Color
Keywords
- #Content-Based Slides
- #Design-Based Slides
- #Market and Competitor Analysis
- #Financial Plans and Performance
- #Graph
- #Industry Trends
- #Sales and Revenue
- #Column
- #Segmented Column
- #16:9
- #segmented bar chart PowerPoint
- #4-series bar graph slide
- #year-over-year comparison template
- #data visualization PowerPoint slide
- #multi-series chart template download
About the Product
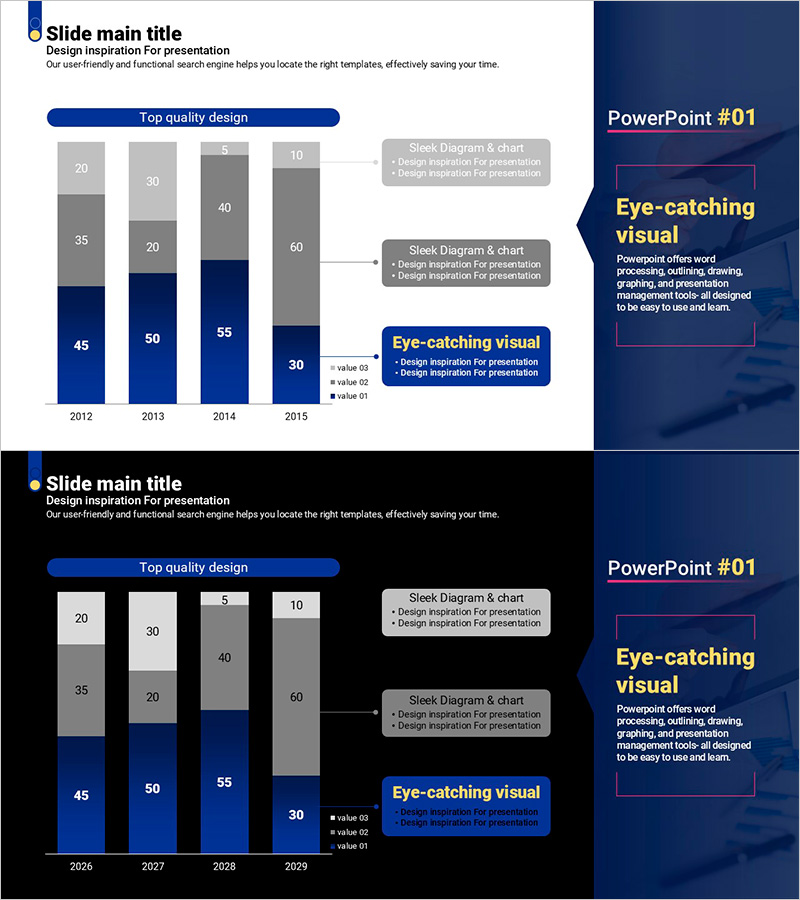
A segmented bar chart PowerPoint slide that visualizes data changes across 4 series from 2012 to 2015. Each year displays multiple bars side by side, enabling clear comparison of numerical differences between categories. The purple gradient background combined with dark blue accent colors highlights the data area, while the right-side explanation panel provides space for key messages and insights. This presentation template is ready to use for market analysis, financial performance reports, competitive benchmarking, and various business presentations.
Usage Points
-
Main Usage
Visualize multi-category numerical comparisons across time periods using 4 distinct data series. The segmented bar structure allows simultaneous tracking of multiple metrics, making it ideal for presenting market size trends, sales volume comparisons, and competitive performance analysis with clarity and impact.
-
How to Use
Input actual data values in the left graph area and adjust bar heights accordingly. Maintain the purple and dark blue color scheme while differentiating each data series by color for enhanced readability. Insert into business reports, financial presentations, marketing plans, or executive briefings to strengthen data-driven arguments and conclusions.
-
Recommended For
Finance professionals, marketing analysts, business planning teams, and executives preparing performance reports. Recommended for quarterly and annual performance comparisons, market share analysis, competitive benchmarking, sales channel performance tracking, and multi-metric business reviews.
-
Slide Structure
2-slide layout featuring a 4-series segmented bar chart on the left (4 years × 4 bars per year) with a purple background explanation panel on the right. Chart includes legend indicators (value 01, 02, 03) at the bottom and dedicated text areas for title, subtitle, and detailed description in the right panel.
Related Products
-

Hologram Wide PPT Table & Segmentation Bar Graph – Trendy Data Visualization
#Market and Competitor Analysis #Financial Plans and Performance #Diagram
-

Horizontal Bar Chart Visualizing Herb Tea Sales Trends
#Market and Competitor Analysis #Financial Plans and Performance #Graph
-

Structure Presentation Template Segmented Vertical Bar Graph – Market Trends and Performance Analysis
#Market and Competitor Analysis #Financial Plans and Performance #Diagram
-

Visualizing Percentage of Product Sales by Period with Bar Charts – Market and Revenue Analysis
#Market and Competitor Analysis #Financial Plans and Performance #Graph
