Horizontal Bar Chart Visualizing Herb Tea Sales Trends
RJ0800032_25
- Last Update 08/09/2025
- File Size 5.1MB
- # of Slides 2
- File Format PPTX
- Slide Ratio 16:9
- Color
Keywords
- #Content-Based Slides
- #Design-Based Slides
- #Market and Competitor Analysis
- #Financial Plans and Performance
- #Graph
- #Industry Trends
- #Sales and Revenue
- #Column
- #Segmented Column
- #16:9
- #vertical bar chart PowerPoint
- #grouped bar graph slide
- #sales trend visualization
- #quarterly comparison chart
- #how to create bar chart in PowerPoint
About the Product
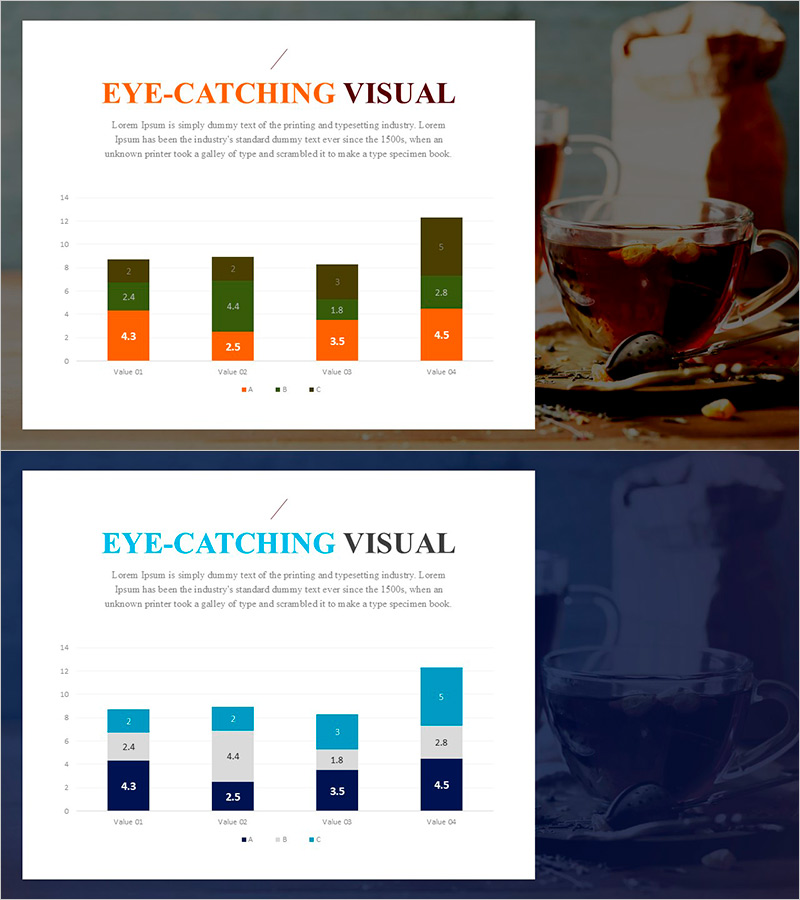
A vertical bar chart PowerPoint slide comparing herb tea sales across four quarters with three product series. The grouped bar chart uses orange, green, and navy blue to represent different product lines, making it easy to track sales trends at a glance. The 2-slide set features a warm-toned background with tea imagery on the first slide and a dark background with clear numerical comparisons on the second. Ready to use in quarterly sales reports, performance presentations, and market analysis decks.
Usage Points
-
Main Usage
Visualize product-by-quarter sales data to communicate sales trends and performance clearly. The three-color bar series enables simultaneous comparison of multiple product lines' growth rates, making it ideal for executive reports and marketing strategy development.
-
How to Use
Input quarterly sales figures into the bar heights for real-time data updates. Use the warm-toned background slide in product introduction sections and the dark background slide in results analysis sections to match document flow.
-
Recommended For
Marketing managers, sales directors, and business analysts presenting quarterly results, market analysis, and product performance comparisons. Particularly useful for beverage, food, and consumer goods industries tracking sales trends.
-
Slide Structure
Two-slide set. First slide features warm background with tea imagery and vertical bar chart showing 4 quarters (Q1–Q4) × 3 product series. Second slide displays the same data on dark background with clear numerical labels. Includes legend, axis labels, and gridlines for data readability.
Related Products
-

Visualizing Percentage of Product Sales by Period with Bar Charts – Market and Revenue Analysis
#Market and Competitor Analysis #Financial Plans and Performance #Graph
-

Curved Theme Purple Template Segmentation Bar Graph
#Market and Competitor Analysis #Financial Plans and Performance #Graph
-

Structure Presentation Template Segmented Vertical Bar Graph – Market Trends and Performance Analysis
#Market and Competitor Analysis #Financial Plans and Performance #Diagram
-

Hologram Wide PPT Table & Segmentation Bar Graph – Trendy Data Visualization
#Market and Competitor Analysis #Financial Plans and Performance #Diagram
