Car Donut Chart Presentation Template – Marketing Strategy
RJ0200044_5
- Last Update 04/10/2025
- File Size 4.4MB
- # of Slides 2
- File Format PPTX
- Slide Ratio 16:9
- Color
Keywords
- #Content-Based Slides
- #Design-Based Slides
- #Product/Service Introduction
- #Business Introduction
- #Marketing Plan and Strategy
- #Graph
- #Development Status
- #Revenue Model
- #Circles
- #Doughnut Chart
- #16:9
- #donut chart PowerPoint slide
- #pie chart presentation template
- #ratio comparison graph
- #marketing analytics slide
- #donut graph download
- #how to create donut chart in PowerPoint
About the Product
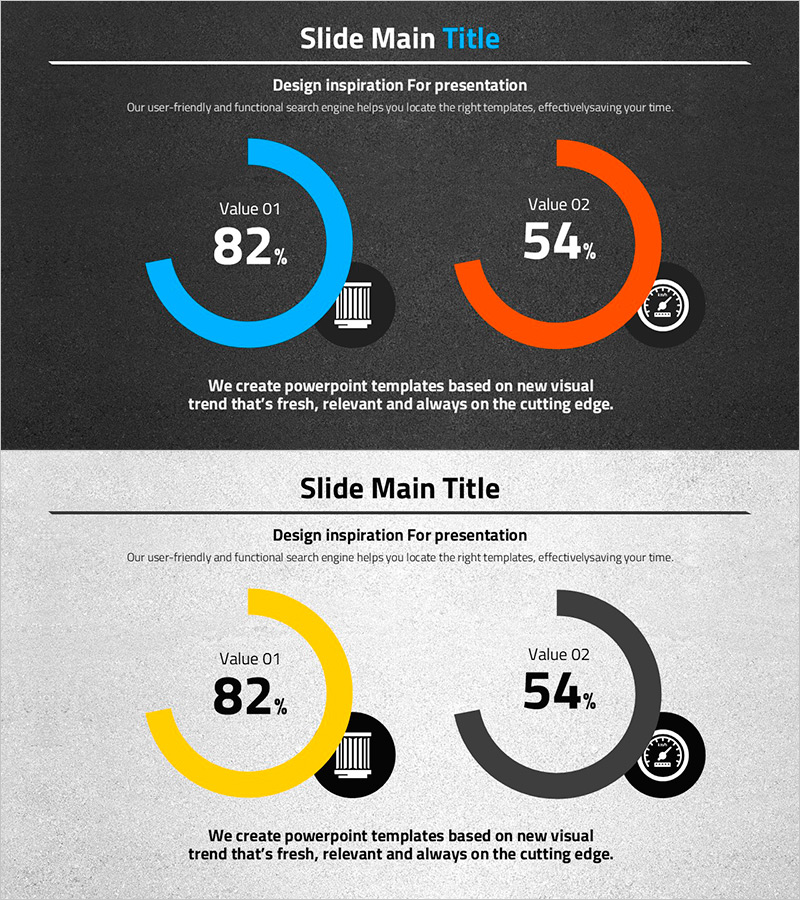
A donut chart PowerPoint slide optimized for marketing strategy presentations. This 2-slide set features two donut graphs in blue and orange color schemes to intuitively display numerical ratios. Both dark and light background versions are included to match any presentation environment. Each donut chart combines percentage values with icon elements to clearly convey data meaning. Instantly applicable for automotive industry analysis, marketing performance reviews, market share comparisons, and various business scenarios requiring ratio visualization.
Usage Points
-
Main Usage
Visualize key marketing metrics such as market share, customer distribution, and sales ratios using dual donut charts. The combination of percentage values and icon elements enables audiences to grasp data insights at a glance during strategy presentations.
-
How to Use
Use the dark background slide for projector-based presentations in large conference rooms, and the light background slide for printed materials or online sharing. Edit the chart colors and values to match your data and deploy immediately as presentation content.
-
Recommended For
Marketing managers, sales strategists, executive report coordinators, and market analysts who need to communicate ratio-based data effectively. Applicable across automotive, consumer goods, finance, and other industries.
-
Slide Structure
Two-slide layout with two donut charts per slide (Value 01, Value 02). Each donut uses arc-shaped graph design with percentage values centered, and icon elements positioned at the bottom right to visually distinguish data categories. Optimized for 16:9 widescreen format.
Related Products
-

Automotive Technology Revenue Model Analysis Chart – Modern and Sleek Design
#Product/Service Introduction #Business Introduction #Diagram
-

Profit Structure Analysis Donut Chart
#Product/Service Introduction #Business Introduction #Diagram
-

Modern Blue Doughnut Chart – Visualizing Marketing Strategies
#Product/Service Introduction #Marketing Plan and Strategy #Graph
-

Donut Chart for Business Strategy Visualization – Performance-Focused Marketing
#Business Introduction #Business Strategy #Marketing Plan and Strategy
