Blue Line Template Donut Chart for Business Overview
RJ0200066_8
- Last Update 04/18/2025
- File Size 0.2MB
- # of Slides 2
- File Format PPTX
- Slide Ratio 16:9
- Color
Keywords
- #Content-Based Slides
- #Design-Based Slides
- #Business Introduction
- #Operational Plan
- #Graph
- #Technological Status
- #Production and Technology Development Strategy
- #Circles
- #Doughnut Chart
- #16:9
- #donut chart PowerPoint slide
- #pie chart presentation template
- #data visualization slides
- #business metrics PPT
- #percentage data slide design
About the Product
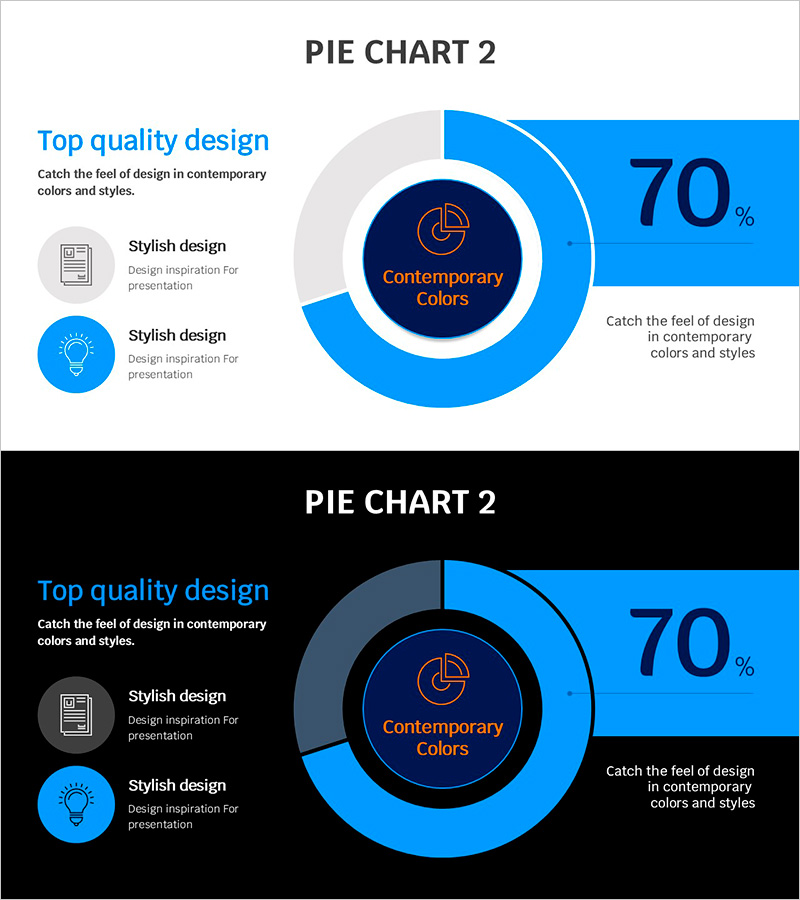
A professional donut chart PowerPoint slide designed to present business metrics and performance indicators at a glance. This presentation template features a two-tone blue color scheme combining bright sky blue with navy accents, creating a modern data visualization layout. The donut chart displays percentage data with the central circle reserved for key messages or branding elements. Supporting icons and text descriptions are positioned on the left side to enhance information clarity. This slide deck is ready to use for business performance reports, operational planning updates, technology adoption metrics, and strategic overview presentations.
Usage Points
-
Main Usage
This donut chart slide excels at visualizing proportional data and part-to-whole relationships. The central circle area accommodates key messages, logos, or focal information, while the outer donut ring displays percentage values. Ideal for presenting operational efficiency rates, technology adoption percentages, market share data, and performance metrics in executive presentations.
-
How to Use
Open the slide and replace the chart data and labels with your own metrics. Edit the left-side icons and text descriptions to match your presentation topic. The blue color palette can be adjusted to align with your corporate branding. The 2-slide format allows you to create comparative analysis or show performance trends across different time periods.
-
Recommended For
Recommended for executive briefings, business performance reports, technology implementation status updates, and operational efficiency analyses. Marketing teams can use it for campaign performance metrics, development teams for project progress reporting, and planning teams for strategic execution status sharing.
-
Slide Structure
Two-slide template with one donut chart per slide. Each chart displays a 70% ratio with the percentage value prominently shown. The central circle contains 'Contemporary Colors' text with an icon. Left side features two icon-text pairs for supporting information, with an additional description area on the right side for context or supplementary details.
Related Products
-

Donut Pie Chart for Medical Technology – Market Share Analysis
#Business Introduction #Market and Competitor Analysis #Graph
-

Business Project Development Status Analysis Graph
#Product/Service Introduction #Business Introduction #Graph
-

Mobile App Service Development Status – Doughnut Chart Visualization
#Product/Service Introduction #Business Introduction #Graph
-

Visualizing Operational Strategies with Donut Charts – Achievements and Goals
#Operational Plan #Marketing Plan and Strategy #Graph
