Simple PPT Wide Template Vertical Bar & Table
RJ0200065_6
- Last Update 04/17/2025
- File Size 0.2MB
- # of Slides 2
- File Format PPTX
- Slide Ratio 16:9
- Color
Keywords
- #Content-Based Slides
- #Design-Based Slides
- #Financial Plans and Performance
- #Diagram
- #Graph
- #Sales and Revenue
- #Table
- #Column
- #Standard Table
- #Segmented Column
- #16:9
- #vertical bar chart PowerPoint
- #bar graph slide template
- #data comparison presentation
- #financial data visualization slide
- #table chart PowerPoint template download
About the Product
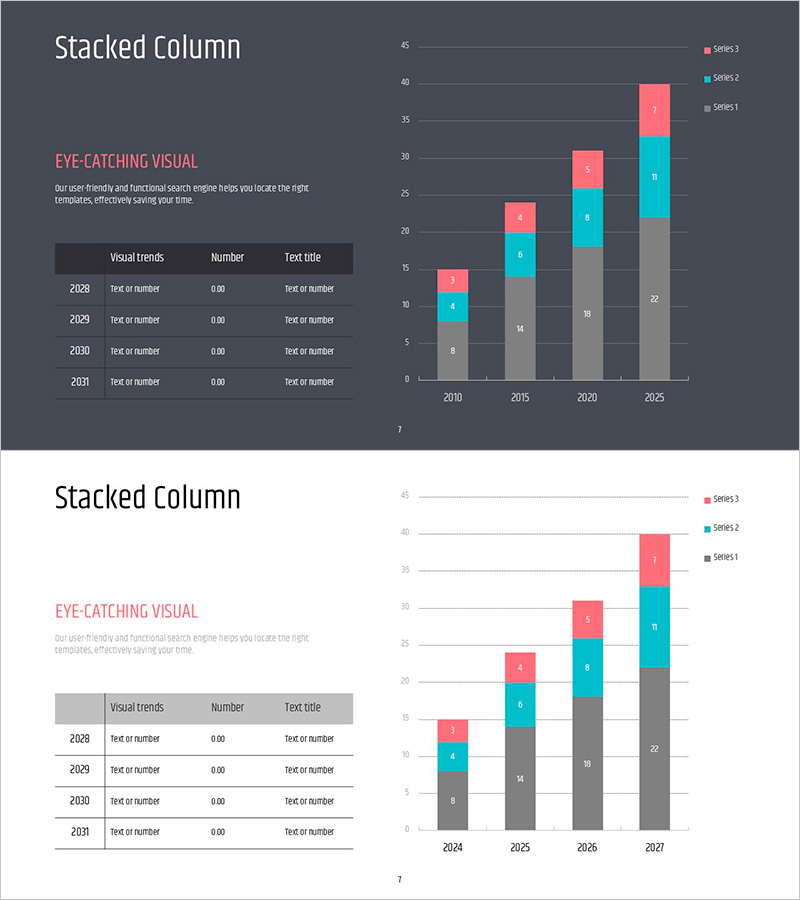
A PowerPoint slide template designed for presentations requiring year-over-year data comparison and information organization. This slide combines a vertical bar chart with three data series and a 4-row by 3-column data table, enabling simultaneous visual representation of numerical data and detailed information display. The dark background features pink, teal, and gray color series to differentiate data, with numerical labels on each bar for precise value comparison. This presentation template is ready to use for business performance reports, financial analysis, market research, and other data-driven PowerPoint presentations.
Usage Points
-
Main Usage
This slide compares numerical data across years or categories using a vertical bar chart and organizes detailed information in a table format, providing clear quantitative evidence. It strengthens data credibility in presentations covering business performance, financial status, and market statistics.
-
How to Use
Edit the bar chart values and table data to match your presentation content. Clearly define graph legends and table headers, and use color differentiation to highlight key data points and increase audience engagement. Suitable for business reports, investor presentations, and marketing strategy briefings.
-
Recommended For
Finance teams, executives, marketing departments, and sales teams presenting quarterly or annual performance results. Effective for business plans, performance reports, investor relations presentations, and marketing proposals where data credibility is essential.
-
Slide Structure
Layout features a title area on the left and a graph-table area on the right. A vertical bar chart displays 3 data series across 4 years (2010–2025) with numerical labels on each bar, paired with a 4-row by 3-column data table (Visual trends, Number, Text title columns). Data is differentiated using pink, teal, and gray color series.
Related Products
-

Hologram Wide PPT Table & Segmentation Bar Graph – Trendy Data Visualization
#Market and Competitor Analysis #Financial Plans and Performance #Diagram
-

Structure Presentation Template Segmented Vertical Bar Graph – Market Trends and Performance Analysis
#Market and Competitor Analysis #Financial Plans and Performance #Diagram
-

Table of Contents for Business Success – Financial Planning and Performance
#Financial Plans and Performance #Diagram #Income Statement
-

Business Sales and Profit Calculation Table – Essential Slide for Financial Planning
#Financial Plans and Performance #Diagram #Income Statement
