Linear Flow Diagram for Service Implementation Plan
RJ0200065_20
- Last Update 04/17/2025
- File Size 0.2MB
- # of Slides 2
- File Format PPTX
- Slide Ratio 16:9
- Color
Keywords
- #Content-Based Slides
- #Design-Based Slides
- #Operational Plan
- #Technical Approach
- #Diagram
- #Risk Management
- #Service Implementation Plan
- #Flow
- #Linear Flow
- #16:9
- #bidirectional cycle flow diagram PowerPoint
- #process flow diagram slide
- #service implementation PPT
- #2-stage cycle diagram
- #business process diagram PowerPoint
- #operational planning presentation template
About the Product
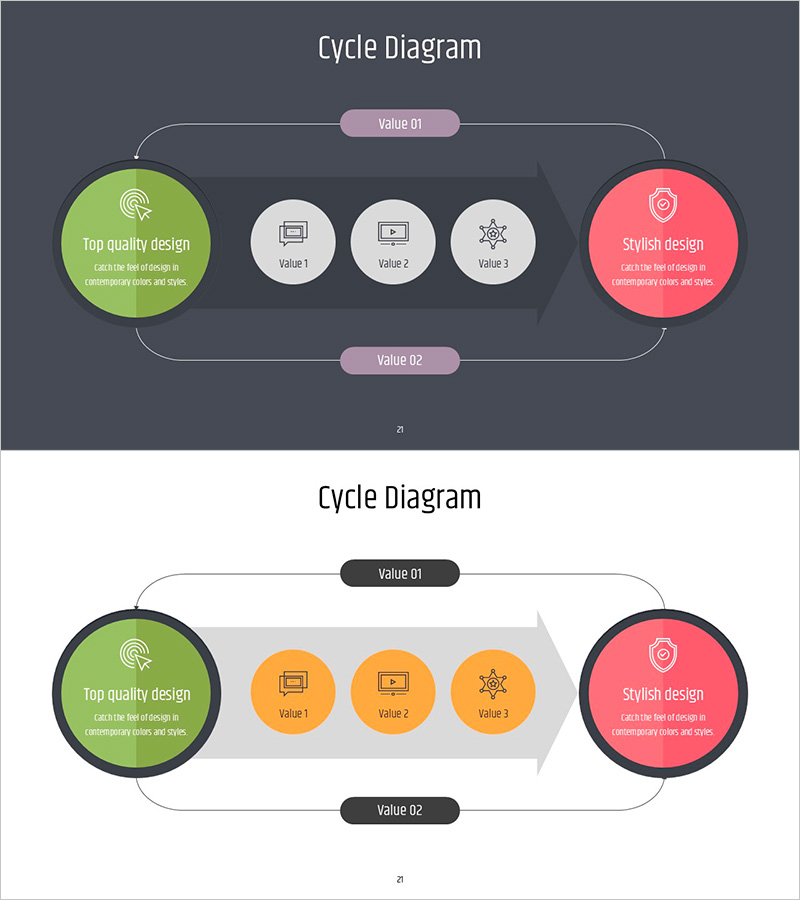
A bidirectional cycle flow diagram PowerPoint slide designed to visualize service implementation plans and operational strategies. The slide features contrasting circular nodes in lime green (left) and coral pink (right) with three gray circular nodes in the center representing intermediate stages. Labeled boxes at the top and bottom clearly delineate the process flow, while directional arrows emphasize the bidirectional cyclical relationship. Set against a dark gray background with vibrant color contrast for enhanced presentation clarity. Ideal for business strategy, risk management, and operational planning sections. Two-slide set provides alternative background color options for flexible presentation design.
Usage Points
-
Main Usage
Communicates the step-by-step process of service implementation and emphasizes bidirectional cyclical relationships. Highlights mutual interactions and feedback loops to clarify the connectivity between operational planning and risk management strategies.
-
How to Use
Enter initial stage content (e.g., planning, design) in the left green node, intermediate stages (e.g., development, testing, deployment) in the center gray nodes, and final stage content (e.g., operation, improvement) in the right pink node. Customize the top and bottom labels to name each cycle phase and edit all text to match your specific process.
-
Recommended For
Recommended for executives, project managers, and consultants responsible for business strategy, operational planning, and risk management. Effective for presentations on IT service implementation, product development processes, and organizational improvement initiatives requiring cyclical process explanation.
-
Slide Structure
Two-slide set with identical structure and varying background colors. Each slide contains large circular nodes on left and right (with icons), three smaller circular nodes in center, labeled boxes at top and bottom, and bidirectional arrows connecting all elements. 16:9 aspect ratio, PPTX format with fully editable components.
Related Products
-

Green & Gray Template Wide Diagram6
#Business Vision and Strategy #Operational Plan #Diagram
-

Circular Process Structure Slide - Service Execution Strategy
#Technical Approach #Diagram #Service Implementation Plan
-

Carbon Neutral Service Implementation Diagram - A Clear and Efficient Roadmap
#Technical Approach #Diagram #Service Implementation Plan
-

Infographic Slide for Service Deployment Strategy
#Product/Service Introduction #Technical Approach #Diagram
