Water Resources Donut Chart Presentation Template
RJ0200062_17
- Last Update 04/16/2025
- File Size 1.8MB
- # of Slides 2
- File Format PPTX
- Slide Ratio 16:9
- Color
Keywords
- #Content-Based Slides
- #Design-Based Slides
- #Business Strategy
- #Market and Competitor Analysis
- #Graph
- #Achievements
- #Market Analysis
- #Circles
- #Doughnut Chart
- #16:9
- #donut chart PowerPoint
- #pie chart slide template
- #ratio comparison presentation
- #data visualization PPT
- #donut graph template
- #business analysis slides
About the Product
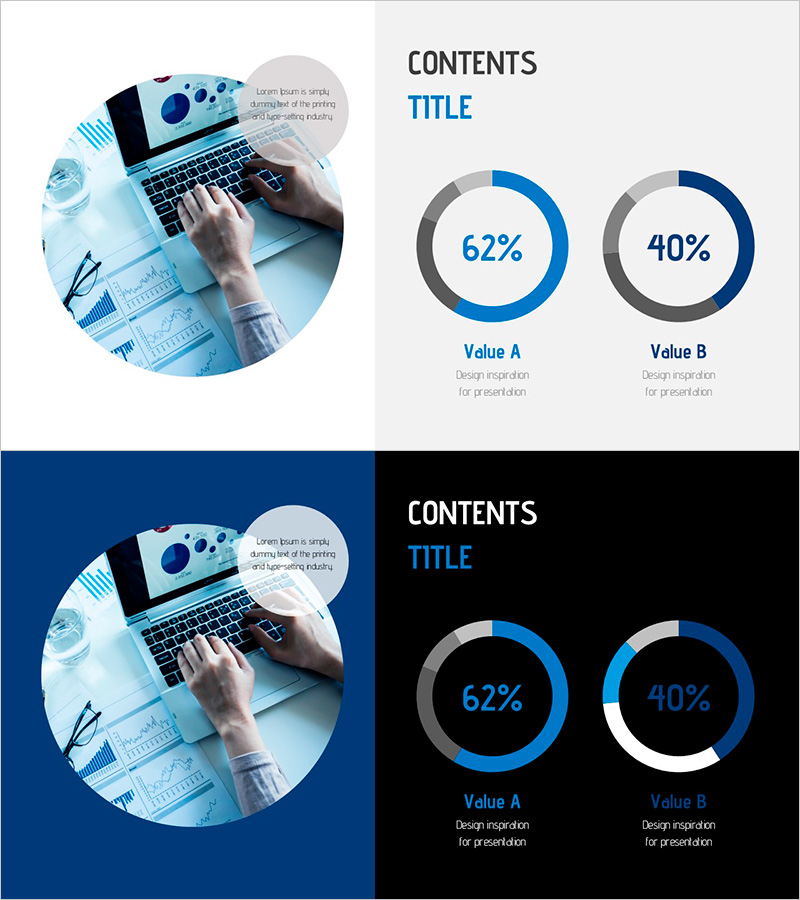
A professional donut chart PowerPoint slide designed to visualize water resource allocation and comparative data analysis. The layout features a circular image on the left side paired with two donut graphs on the right, displaying 62% and 40% values in blue and gray tones. This slide template is ideal for business strategy presentations, market analysis reports, and resource utilization discussions. The 16:9 widescreen format with 2-slide set ensures compatibility with modern presentation environments. Fully editable and ready for immediate use in corporate presentations, investor pitches, and strategic planning sessions.
Usage Points
-
Main Usage
Effectively visualize two-part data ratios such as resource allocation, market share, or percentage distribution using donut chart format. The dual-layout design combines contextual imagery on the left with quantitative data visualization on the right, enabling comprehensive data storytelling in a single slide.
-
How to Use
Apply this slide in business strategy presentations, market analysis reports, resource allocation discussions, and investor relations materials. Simply replace the donut graph percentages with your actual data, update the 'Value A' and 'Value B' labels, and substitute the left-side image with relevant photography. The template is fully editable in PowerPoint.
-
Recommended For
Ideal for executives, business analysts, marketing teams, financial professionals, and management consultants presenting quantitative data. Particularly effective for industries such as water resources, energy, environmental management, finance, and distribution where resource allocation and market composition require clear visual representation.
-
Slide Structure
Both slides maintain identical layout structure. Left side features a circular image area (workspace/laptop/analytical imagery), right side displays 'CONTENTS TITLE' header text, and two donut graphs below with 62% and 40% values labeled as 'Value A' and 'Value B' respectively.
Related Products
-

Donut Chart Comparison Slide | Data Visualization PPT
#Business Strategy #Market and Competitor Analysis #Graph
-

Business Promotion Strategy Slide Template – Effective Market and Competitor Analysis
#Business Strategy #Market and Competitor Analysis #Graph
-

Doughnut Chart for Work Progress and Detailed Investigation
#Business Strategy #Market and Competitor Analysis #Graph
-

Cosmetic Ingredient Ratio Chart – Doughnut Slide for Market Analysis
#Business Strategy #Market and Competitor Analysis #Graph
