Water Resources Vertical Bar Chart Presentation Template
RJ0200062_12
- Last Update 04/16/2025
- File Size 0.5MB
- # of Slides 2
- File Format PPTX
- Slide Ratio 16:9
- Color
Keywords
- #Content-Based Slides
- #Design-Based Slides
- #Product/Service Introduction
- #Market and Competitor Analysis
- #Graph
- #Development Status
- #Market Status
- #Column
- #Grouped Column
- #16:9
- #vertical bar chart PowerPoint
- #water resources data presentation
- #bar graph slide template
- #comparative analysis chart
- #data visualization PowerPoint slide
About the Product
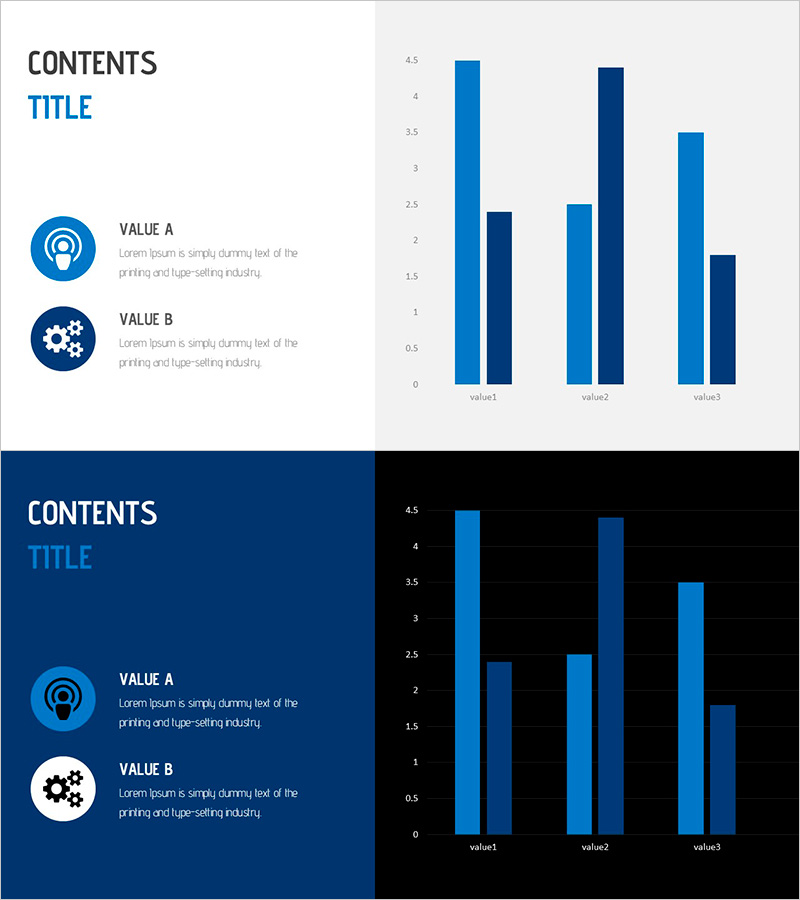
A vertical bar chart PowerPoint slide optimized for water resources data analysis and comparative presentations. Featuring light blue and dark blue dual-series bars, this slide enables simultaneous comparison of three data points across two categories. The 16:9 widescreen layout provides a clean, professional design ready for immediate use in presentations. Ideal for water resource management reports, environmental data analysis, business statistics, and policy briefings.
Usage Points
-
Main Usage
Presents water resource policies, environmental statistics, and business data through dual-series comparison, enabling clear communication of numerical differences to audiences. The vertical bar structure provides intuitive visual representation of comparative metrics across categories.
-
How to Use
Input actual data values at the value1, value2, and value3 label positions, then adjust bar heights to reflect your data. Use PowerPoint's built-in chart editing tools to customize colors and values. Insert the slide into your presentation's data analysis or findings section for immediate impact.
-
Recommended For
Environmental policy specialists, water resource managers, business analysts, academic presenters, and government report writers conducting data-driven presentations. Particularly effective when comparing two metrics or displaying time-series data requiring dual-category visualization.
-
Slide Structure
Two-slide set featuring vertical bar charts with light blue and dark blue dual-series bars. Each slide displays three data points (value1, value2, value3) with paired bars for each category, enabling both item-to-item and series-to-series comparisons in a single visual.
Related Products
-

Visually Appealing Presentation Slide – Stylish Design
#Product/Service Introduction #Market and Competitor Analysis #Graph
-

Muscle Mass Change Graph – Market Analysis Presentation
#Market and Competitor Analysis #Graph #Market Status
-

Farm Icon Donut Chart – Data Visualization and Analysis
#Product/Service Introduction #Market and Competitor Analysis #Graph
-

Start of the Challenge Vertical Bar Graph – Market Analysis
#Market and Competitor Analysis #Graph #Market Status
