Gradient PPT Wide Template Vertical Bar Comparison Graph
RJ0200060_8
- Last Update 04/16/2025
- File Size 0.3MB
- # of Slides 2
- File Format PPTX
- Slide Ratio 16:9
- Color
Keywords
- #Content-Based Slides
- #Design-Based Slides
- #Market and Competitor Analysis
- #Graph
- #Competitor Analysis
- #Competitive Advantage
- #Column
- #Column Chart
- #16:9
- #vertical bar chart PowerPoint
- #bar graph slide template
- #comparison chart PPT
- #market analysis presentation
- #competitive analysis slide
- #gradient chart template
- #how to create bar chart in PowerPoint
About the Product
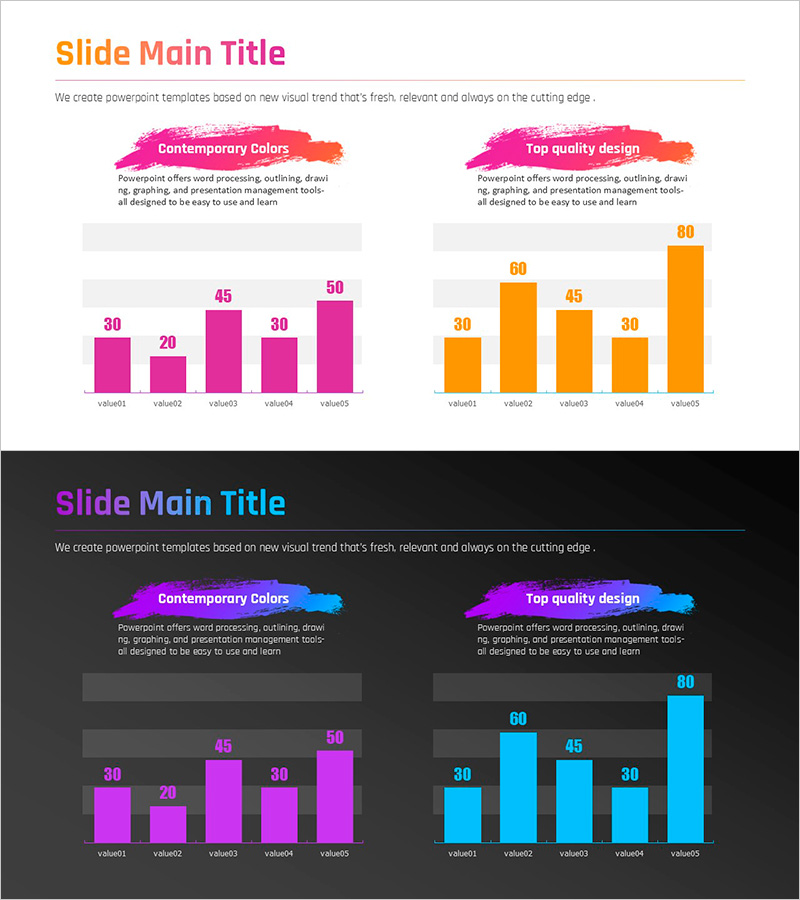
A vertical bar chart PowerPoint slide optimized for market analysis and competitive comparison. The gradient color transition from magenta to orange visually emphasizes data variation, enabling clear comparison of five data points with labeled values displayed above each bar. This 2-slide deck in 16:9 widescreen format is ready for immediate use in presentations. Ideal for marketing reports, quarterly performance reviews, competitive benchmarking, and data-driven business presentations where numerical comparison is essential.
Usage Points
-
Main Usage
Visually compare five numerical data points through bar height and labeled values, with gradient color progression from magenta to orange representing data flow or priority shift. Effectively communicates quantitative analysis results such as sales performance, market share, competitive metrics, and trend analysis in a single glance.
-
How to Use
Each bar's height and numeric label immediately show relative magnitude and ranking. The magenta-to-orange gradient subtly indicates progression or priority hierarchy from first to last item. Use during presentations to sequentially explain each data point or emphasize top performers. Easily edit values and labels to match your specific data.
-
Recommended For
Marketing and sales teams presenting quarterly performance, executive reports comparing competitors, market research findings, product sales trends, customer satisfaction surveys, and financial performance analysis. Suitable for marketing managers, business analysts, consultants, and executives requiring data-driven decision support.
-
Slide Structure
Two-slide deck: Slide 1 features five magenta-gradient bars (values: 30, 20, 45, 30, 50); Slide 2 displays five orange-gradient bars (values: 30, 60, 45, 30, 80). Each slide includes a title area and descriptive text box for context. 16:9 widescreen format optimized for modern projectors and displays.
Related Products
-

Layout Design Presentation Template – Column Chart
#Market and Competitor Analysis #Graph #Competitor Analysis
-

Ice Hockey Performance Graph – Competitiveness and Advantage
#Market and Competitor Analysis #Graph #Competitor Analysis
-

Camera Comparison Competitive Analysis Slide - Data-Driven Strategy
#Market and Competitor Analysis #Graph #Competitor Analysis
-

Competitor Comparison Analysis Bar Graph
#Market and Competitor Analysis #Graph #Competitor Analysis
