Visualizing Technology & Connection Concepts with Relationship Diagrams – Innovation and Collaboration
RJ0200060_15
- Last Update 04/16/2025
- File Size 0.2MB
- # of Slides 2
- File Format PPTX
- Slide Ratio 16:9
- Color
Keywords
- #Content-Based Slides
- #Design-Based Slides
- #Operational Plan
- #Technical Approach
- #Diagram
- #Business Processes
- #Research and Development
- #Cluster
- #Chain Diagram
- #16:9
- #gear diagram PowerPoint
- #connection relationship chart
- #technology collaboration slide
- #radial diagram PPT
- #node connection presentation
About the Product
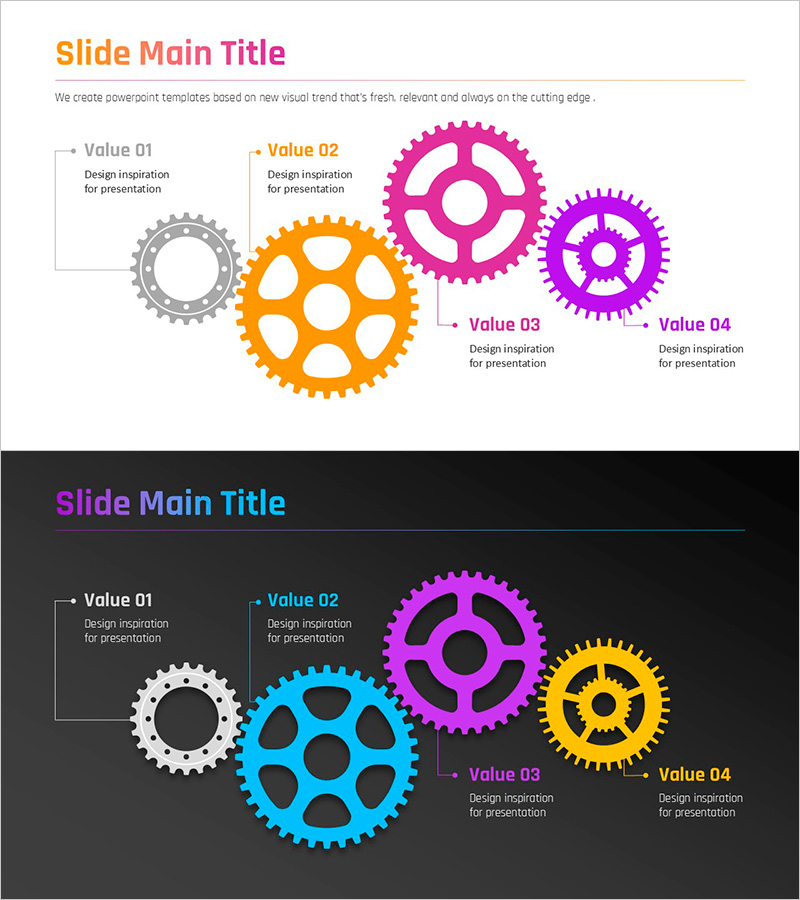
A PowerPoint slide featuring a gear-based connection diagram that visualizes technology and collaboration concepts. Four gear nodes in gray, orange, magenta, and purple are arranged in a radial pattern from the center, representing interconnected relationships. Each node includes Value 01–04 labels with dedicated text areas for descriptions, making it immediately applicable to technology innovation, collaboration processes, interdepartmental coordination, and system integration scenarios. The 2-slide set provides both light and dark background versions, allowing you to select the appropriate design for your presentation environment.
Usage Points
-
Main Usage
Optimized for expressing interconnected relationships in technology innovation, interdepartmental collaboration, system integration, and process coordination. The interlocking gear shapes emphasize mutual dependency and simultaneous operation while conveying both the independent role of each node and the harmony of the overall system.
-
How to Use
Use in technology presentations, organizational structure explanations, collaboration process introductions, and system architecture descriptions by editing the node text and colors. Select the light background version for daytime presentations or printing, and the dark background version for evening presentations or video recording.
-
Recommended For
Technology managers, project managers, organizational development specialists, marketing planners, and executives preparing reports. Particularly effective in IT companies, manufacturing, financial institutions, and consulting firms when explaining technology innovation, digital transformation, and cross-organizational collaboration.
-
Slide Structure
Slide 1 (light background): Title area + 4 gear nodes (gray, orange, magenta, purple) + Value labels and description text boxes for each node. Slide 2 (dark background): Identical structure with dark theme applied. All elements are fully editable with adjustable colors, text, and node sizes.
Related Products
-

Business Process Diagram – Optimizing Workflow
#Business Strategy #Operational Plan #Diagram
-

Step-by-Step Work Process Connection Diagram – Clear Visualization for Business Strategy
#Business Strategy #Operational Plan #Diagram
-

Business Schedule and Process Diagram – Travel Business
#Operational Plan #Technical Approach #Diagram
-

Music Video Shooting Process – Engaging Visual Storytelling
#Product/Service Introduction #Operational Plan #Diagram
