Simple Design Trend Wide PPT Radar Chart
RJ0200059_30
- Last Update 04/15/2025
- File Size 0.2MB
- # of Slides 2
- File Format PPTX
- Slide Ratio 16:9
- Color
Keywords
- #Content-Based Slides
- #Design-Based Slides
- #Technical Approach
- #Market and Competitor Analysis
- #Graph
- #Innovative Technologies and Future Plans
- #Industry Trends
- #Other
- #Radar Chart Spider Chart
- #16:9
- #radial chart PowerPoint
- #radar chart slide template
- #6-axis data visualization
- #market analysis slide
- #diagram PowerPoint slide
About the Product
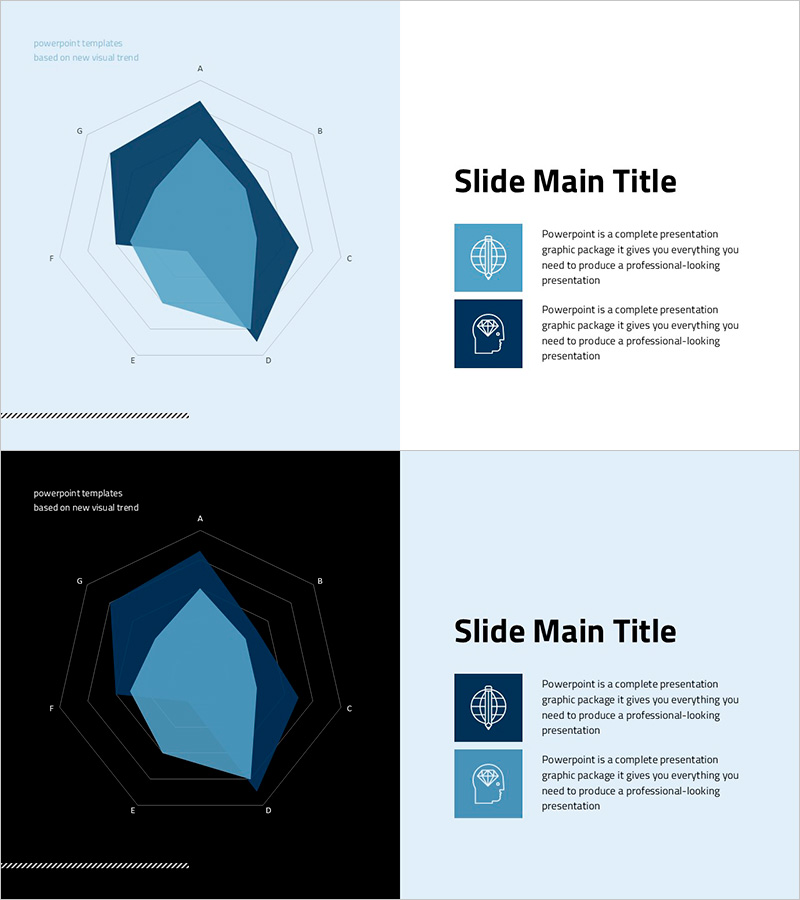
A 6-axis radial radar chart PowerPoint slide designed for multi-dimensional data comparison. Features light blue and dark backgrounds with navy and sky blue layered polygon structures to visualize market trends, technology benchmarks, and competitive positioning. The 2-slide set includes both bright and dark background versions for flexible presentation contexts. Each axis is labeled A–G for immediate data input, with icon-based text description areas on the right to enhance information delivery. Ideal for presentations, reports, and strategic planning documents requiring complex data visualization.
Usage Points
-
Main Usage
Simultaneously compare multi-dimensional data across 6 axes using a radial radar chart. Designed to visualize market analysis, technology trends, product performance, and competitive positioning in a single view. Axis length represents numerical values, making strengths, weaknesses, and differences immediately apparent.
-
How to Use
Input data into the left-side radial chart and add descriptive text with icons on the right. Use the bright background version for standard presentations and reports; use the dark background for executive briefings and premium presentations. Adjust polygon colors and transparency to emphasize specific data points.
-
Recommended For
Strategy and planning teams presenting market analysis, technical teams comparing performance metrics, marketing teams analyzing competitive positioning, executive leadership reporting on overall business status, investor pitch decks, and business plan market environment sections.
-
Slide Structure
2-slide set with identical layouts: left side features a 6-axis radial radar chart with navy and sky blue layered polygons; right side contains 2 icon-text boxes. Title area at top ('Slide Main Title'), divider line at bottom. 16:9 widescreen format.
Related Products
-

Paint Splash Radial Chart Template – Innovation and R&D
#Technical Approach #Graph #Research and Development
-

Weather Bar Subdivision Graph - Innovative Market Analysis
#Technical Approach #Market and Competitor Analysis #Graph
-

Orange Export Trends Visualization Template – Market Growth
#Market and Competitor Analysis #Graph #Industry Trends
-

Market Trends Analysis Chart – Effective for Market and Marketing Strategy
#Market and Competitor Analysis #Marketing Plan and Strategy #Diagram
