Brown Orange Primary Table Chart – Business Management and Organizational Planning
RJ0800012_27
- Last Update 08/03/2025
- File Size 0.2MB
- # of Slides 2
- File Format PPTX
- Slide Ratio 16:9
- Color
Keywords
- #Content-Based Slides
- #Design-Based Slides
- #Business Management
- #Operational Plan
- #Diagram
- #Project Organization and Roles and Responsibilities
- #Organizational Structure and Staffing Plan
- #Table
- #Standard Table
- #16:9
- #data table PowerPoint slide
- #business management chart template
- #organizational planning slide
- #6-column table template
- #comparison table PPT download
About the Product
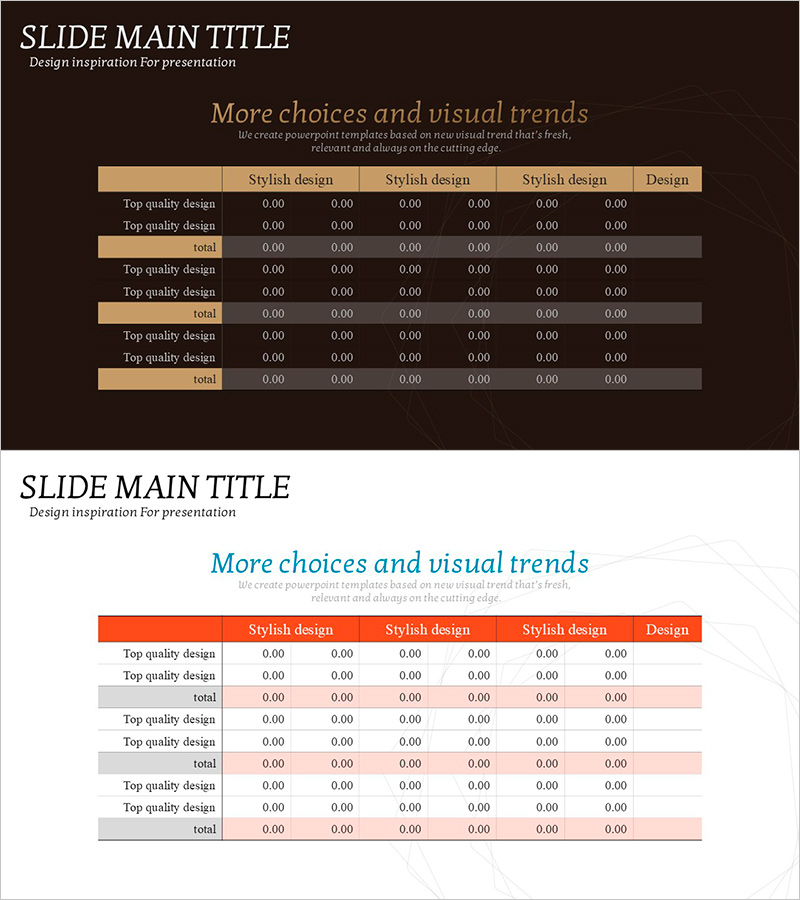
A 6-column data table PowerPoint slide optimized for business management and organizational planning presentations. The brown background with orange header row clearly distinguishes data categories and improves readability. Structured in 3 sections with total rows for each group, this slide template is ideal for comparative analysis, performance metrics, and organizational status summaries. Fully editable for immediate use in business reports and presentations.
Usage Points
-
Main Usage
Organize and compare quantitative data such as departmental performance metrics, organizational status, and project progress. The table structure enables quick visualization of multi-item numerical data, making it ideal for executive reports and organizational planning presentations.
-
How to Use
Enter department names, item labels, and numerical data into each cell. Use the orange header row to highlight column titles and the total row to display cumulative values. The 2-slide layout allows sequential presentation of multiple data sets.
-
Recommended For
Executives, project managers, organizational development specialists, and financial analysts presenting quarterly reports, performance evaluations, and organizational restructuring announcements. Recommended for business plans, periodic reports, and organizational change communications.
-
Slide Structure
2-slide layout. Each slide features a 6-column table with 3 sections (2 data rows + total row per section). Headers use orange background with white text, data rows have gray background, and total rows use dark gray for clear information hierarchy and visual distinction.
Related Products
-

Process Management Checklist Table – Efficient Task Allocation
#Business Management #Diagram #Project Organization and Roles and Responsibilities
-

Process Timeline and Resource Table – Optimizing Operational Plans
#Operational Plan #Diagram #Capital Investment Plan
-

Blue Red Table – Perfect Combination for Business Management and Financial Planning
#Business Management #Financial Plans and Performance #Diagram
-

Korean Traditional Culture Table - Emphasizing Operational Planning and Management Efficiency
#Operational Plan #Diagram #Organizational Structure and Staffing Plan
