Contact Customer Checklist Slide – Customer Analysis and Market Understanding
RJ0800006_19
- Last Update 03/18/2025
- File Size 5.4MB
- # of Slides 4
- File Format PPTX
- Slide Ratio 16:9
- Color
Keywords
- #Content-Based Slides
- #Design-Based Slides
- #Product/Service Introduction
- #Business Management
- #Market and Competitor Analysis
- #Diagram
- #Features
- #Project Organization and Roles and Responsibilities
- #Customer Analysis
- #Table
- #Standard Table
- #16:9
- #checklist table PowerPoint slide
- #customer analysis presentation template
- #comparison table slide deck
- #business management PowerPoint
- #competitive analysis diagram
- #table slide template download
About the Product
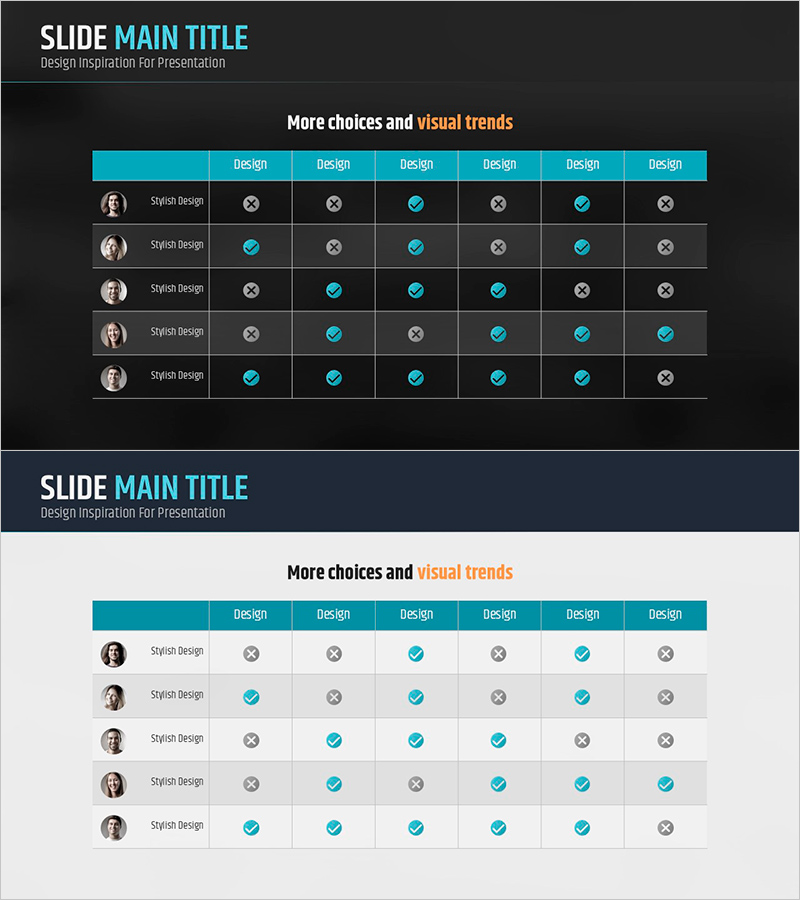
A comprehensive checklist table PowerPoint slide set designed for customer analysis and market understanding. This 4-slide presentation template features a 6-row by 4-column data table with a teal header and white background for optimal readability. Each cell incorporates checkmark (✓) and cross (✕) icons to enable quick comparison of customer characteristics, market trends, and competitive analysis factors. The slides are ready to use in presentations and fully editable—customize the text, icons, and data to match your specific business needs.
Usage Points
-
Main Usage
Organize and compare customer segments, market trends, and competitive factors in a structured table format. Assign analysis subjects (customer groups, competitors, market elements) to rows and evaluation criteria (design preference, functionality, price competitiveness) to columns, then use checkmarks to visualize decision-making data and strategic insights.
-
How to Use
Insert into the 'Market Analysis' or 'Customer Understanding' section of business plans, marketing proposals, or pitch decks. Populate each cell with customer data, market research findings, or competitive intelligence, then mark relevant items with checkmark icons. Ideal for executive briefings, team strategy meetings, and client presentations where data-driven analysis must be communicated clearly.
-
Recommended For
Marketing managers, business development professionals, management consultants, and product strategists who need to present customer segmentation, market research results, or competitive positioning. Recommended for startup pitch decks, corporate strategy sessions, and new product launch planning where structured decision-support information is essential.
-
Slide Structure
All 4 slides feature a consistent 6-row by 4-column table layout. The teal header row contains evaluation criteria labels, while the leftmost column displays analysis subjects with customer profile images. Data cells use teal checkmark icons (✓) and gray cross icons (✕) to represent qualitative assessments. Optimized for 16:9 widescreen format with full editing capability.
Related Products
-

Target Behavior Analysis: Children and Seniors Slide
#Product/Service Introduction #Market and Competitor Analysis #Diagram
-

Human Growth Process Diagram Slide – Smooth Flow and Connectivity
#Product/Service Introduction #Market and Competitor Analysis #Diagram
-

Workload and Schedule Table – Efficient Task Management
#Product/Service Introduction #Business Management #Diagram
-

Businessperson Work Ability Analysis Graph – Successful Ability Assessment
#Product/Service Introduction #Market and Competitor Analysis #Diagram
