Visual Comparison by Product Group Slide Template – Market Trends and Performance
RB0800050_8
- Last Update 03/26/2025
- File Size 1.4MB
- # of Slides 2
- File Format PPTX
- Slide Ratio 4:3
- Color
Keywords
- #Content-Based Slides
- #Design-Based Slides
- #Market and Competitor Analysis
- #Financial Plans and Performance
- #Graph
- #Market Analysis
- #Sales and Revenue
- #Column
- #Grouped Column
- #4:3
- #grouped bar chart PowerPoint
- #data comparison slide template
- #4-item visualization
- #multi-series chart slide
- #product group comparison template
About the Product
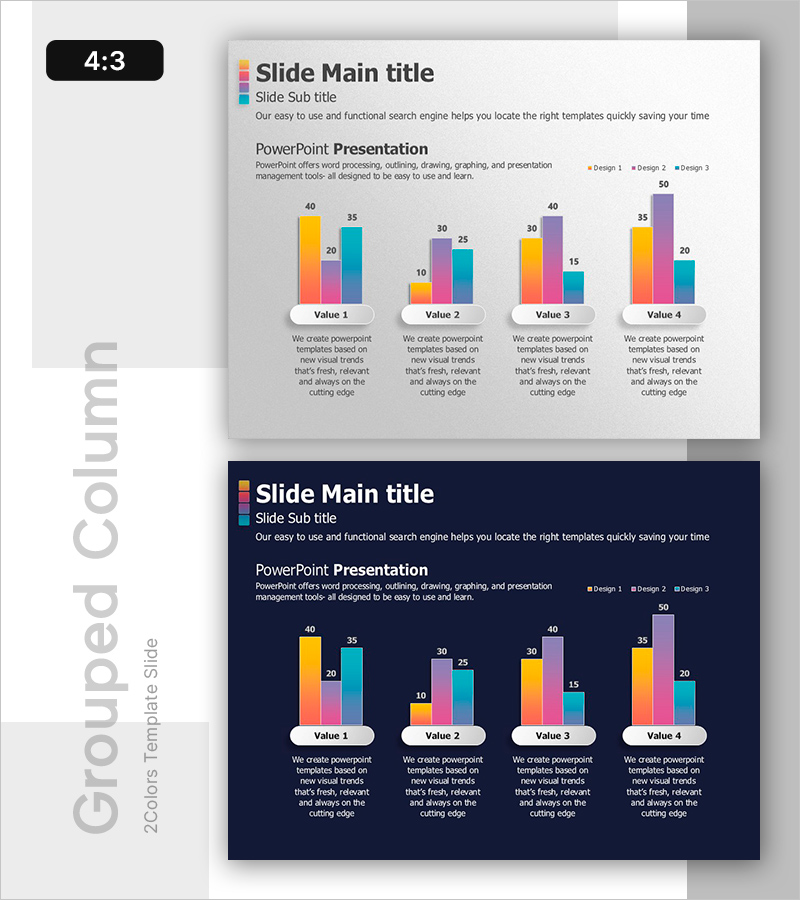
A grouped bar chart PowerPoint slide template for visual product group comparison and analysis. Features four items (Value 1–4) with three data series distinguished by orange, pink, purple, and cyan colors. Provided in two layout versions: light background and dark background, each with descriptive text areas below chart items for market trends, performance, and comparative insights. 4:3 aspect ratio, 2-slide set, fully editable for immediate presentation use.
Usage Points
-
Main Usage
Compare quantitative data across multiple items (product lines, departments, regions) using three data series in a single visual. Designed to present market trends, sales performance, comparative results, and budget allocation at a glance.
-
How to Use
Bar heights and colors represent data values; descriptive text below each item adds analytical context. Select light background for bright venues and dark background for dimly lit presentation spaces.
-
Recommended For
Ideal for sales, marketing, and planning teams presenting quarterly performance reports, product line comparisons, market research findings, and data-driven executive decision-making materials. Also suitable for finance and strategy sections.
-
Slide Structure
Slide 1 (light background): Title area + 4-item grouped bar chart with 3 series + descriptive text boxes per item. Slide 2 (dark background): Identical structure with dark theme. All elements—colors, values, and text—are fully editable.
Related Products
-

Horizontal Bar Chart Visualizing Market Sales Status
#Market and Competitor Analysis #Financial Plans and Performance #Graph
-

Performers and Bundled Charts – Sales and Revenue Analysis
#Market and Competitor Analysis #Financial Plans and Performance #Graph
-

Revenue Vertical Bar Chart – Innovation in Market Analysis
#Market and Competitor Analysis #Financial Plans and Performance #Graph
-

Animal Nature Conservation Program Facility Investment Plan Chart
#Market and Competitor Analysis #Financial Plans and Performance #Graph
