Simple Car Wide Presentation Flow Diagram
RJ0200057_25
- Last Update 04/14/2025
- File Size 0.2MB
- # of Slides 2
- File Format PPTX
- Slide Ratio 16:9
- Color
Keywords
- #Content-Based Slides
- #Design-Based Slides
- #Operational Plan
- #Diagram
- #Production and Technology Development Strategy
- #Business Processes
- #Flow
- #Linear Flow
- #16:9
- #linear flow diagram PowerPoint
- #3-step process PowerPoint slide
- #arrow connector diagram
- #operational process PPT template
- #automotive industry presentation slide
- #how to create flow diagram in PowerPoint
About the Product
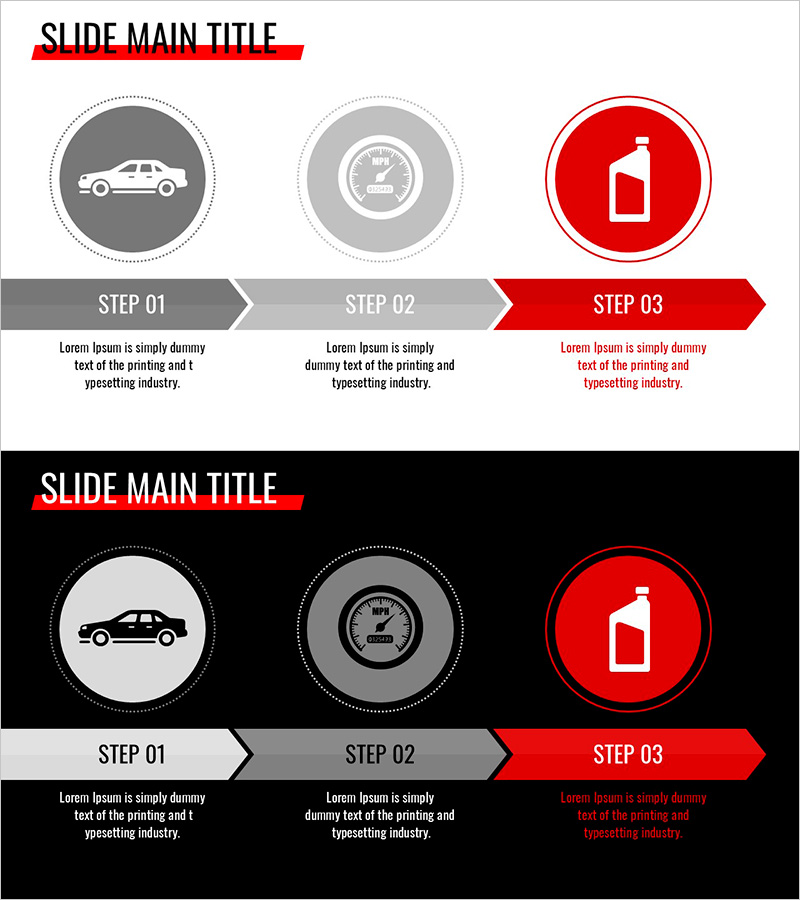
A PowerPoint slide that visualizes automotive operational processes through a 3-step linear flow diagram. Gray, light gray, and red circular icons connected by arrows clearly show each stage of progression. The white background with red accent color highlights the final step, while text description areas are provided below each stage. This 2-slide wide format (16:9) presentation is ready to use for production strategy, operational planning, and process improvement presentations.
Usage Points
-
Main Usage
Clearly communicate automotive operational processes, production stages, and quality management flows divided into 3 steps to your audience. Visually emphasize each stage's role and sequence to transform complex processes into simple, easy-to-understand representations.
-
How to Use
Slide 1 features a white background layout, while Slide 2 offers a black background layout. Customize each stage's text area by entering specific process names, responsible departments, and required timeframes to complete your tailored presentation. Circular icons and arrows are fully adjustable in color and size.
-
Recommended For
Ideal for automotive manufacturers and parts suppliers' operations managers, production planners, and quality assurance teams presenting process improvements, conducting new employee training, and optimizing manufacturing workflows. Effective for executive briefings, customer presentations, and internal workshops.
-
Slide Structure
Each slide contains 3 circular nodes with icons and 2 connecting arrows forming a left-to-right linear progression. Text input areas are positioned below each node, with a slide title area at the top. Two background versions—white and black—accommodate diverse presentation environments.
Related Products
-

Yellow Speech Bubble Emphasis Diagram
#Operational Plan #Diagram #Production and Technology Development Strategy
-

Flow of Chemical Experiment Steps - Linear Process Explanation
#Operational Plan #Diagram #Production and Technology Development Strategy
-

Extreme Sports Jumping Diagram – Dynamic Flow and Structure
#Operational Plan #Diagram #Production and Technology Development Strategy
-

Basic Construction and Technology Strategy – Linear Flow Diagram
#Operational Plan #Diagram #Production and Technology Development Strategy
