Flow of Chemical Experiment Steps - Linear Process Explanation
RB0400002_8
- Last Update 03/11/2025
- File Size 0.4MB
- # of Slides 2
- File Format PPTX
- Slide Ratio 4:3
- Color
Keywords
- #Content-Based Slides
- #Design-Based Slides
- #Operational Plan
- #Diagram
- #Production and Technology Development Strategy
- #Business Processes
- #Flow
- #Cluster
- #Linear Flow
- #Closed Cluster Diagram
- #4:3
- #3-item comparison diagram PowerPoint
- #closed-form diagram slide
- #arrow connection template
- #comparative analysis PPT
- #diagram slide template download
About the Product
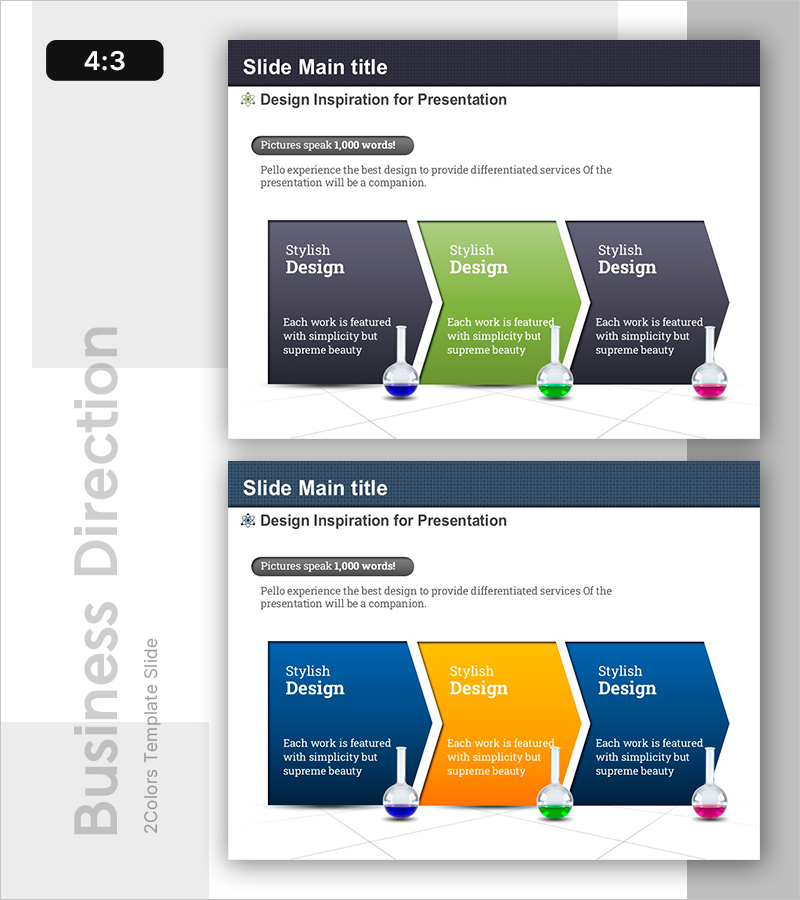
A closed-form comparison diagram PowerPoint slide that visually presents three items and their relationships. Three spherical icons in the center are connected by arrows to clarify mutual connections. Trapezoid boxes in dark gray, lime green, and pink tones contain titles and descriptions for each item, while bottom connector lines emphasize the integrated structure. Ready for immediate use in process explanations, comparative analysis, and three-step flow presentations. Text and colors are fully editable to match your presentation needs.
Usage Points
-
Main Usage
Optimized for conveying the relationships, comparisons, and connection structures of three items at a glance. Visualizes process stages, organizational structures, comparative analyses, and integrated concepts. Central icons and arrow connections emphasize logical flow and hierarchy.
-
How to Use
Place in the overview, strategy, or structure explanation sections of your presentation to simplify complex concepts. Edit the titles and descriptions in text boxes, adjust colors to match your corporate brand, and customize arrows and icons as needed for immediate deployment.
-
Recommended For
Ideal for executives, planning teams, marketing departments, and educators explaining strategies, processes, and comparative analyses. Recommended for business plans, proposals, reports, and educational materials where three items need to be presented structurally.
-
Slide Structure
2-slide set in 4:3 aspect ratio. Each slide features three trapezoid boxes (dark gray, lime green, pink) with three central spherical icons connected by arrows and bottom connector lines. Six text input areas total: one title and one description per box.
Related Products
-

Yellow Speech Bubble Emphasis Diagram
#Operational Plan #Diagram #Production and Technology Development Strategy
-

Flowchart of the Construction Propulsion System
#Business Strategy #Operational Plan #Diagram
-

Presentation Template for Preparing for an Overseas Trip – Business Strategy
#Business Strategy #Operational Plan #Diagram
-

Real Estate Marketing System - Actionable Strategies and Flow
#Operational Plan #Marketing Plan and Strategy #Diagram
