Trend Color Wide Template Bundled Charts
RJ0200045_8
- Last Update 04/11/2025
- File Size 15.2MB
- # of Slides 2
- File Format PPTX
- Slide Ratio 16:9
- Color
Keywords
- #Content-Based Slides
- #Design-Based Slides
- #Market and Competitor Analysis
- #Graph
- #Competitor Analysis
- #Competitive Advantage
- #Column
- #Grouped Column
- #16:9
- #grouped bar chart PowerPoint
- #comparison chart slide template
- #trend color graph
- #market analysis presentation
- #competitive analysis slide download
About the Product
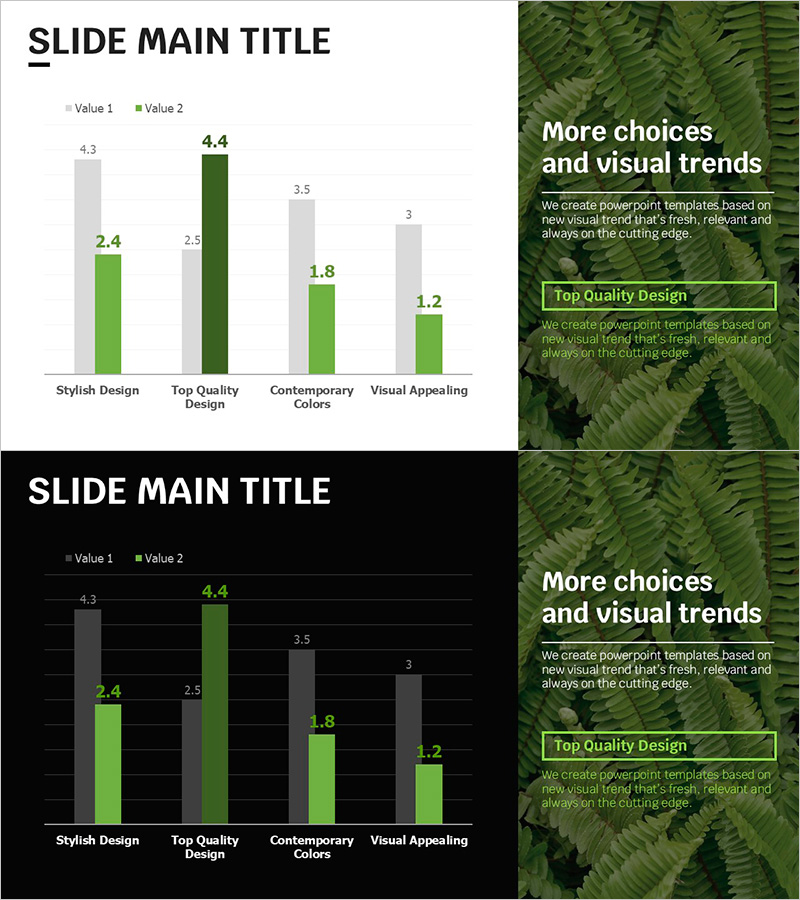
A professional grouped bar chart PowerPoint slide set optimized for market analysis and competitive benchmarking. This 2-slide template features lime green, dark green, and light gray trend colors to compare Value 1 and Value 2 across four categories: Stylish Design, Top Quality Design, Contemporary Colors, and Visual Appealing. Designed in 16:9 widescreen format, it includes both light and dark background versions to adapt to different presentation environments. The intuitive data visualization effectively communicates comparative metrics and captures audience attention during business presentations.
Usage Points
-
Main Usage
Ideal for market analysis, competitive benchmarking, and product performance evaluation where two or more data series need to be compared across four categories. The grouped bar structure clearly highlights differences between values, providing visual evidence for strategic decision-making.
-
How to Use
Double-click the chart values to edit directly, or access the data table to input new figures. Use the light background version in bright conference rooms and the dark version in dimly-lit projection environments for optimal visibility and readability.
-
Recommended For
Recommended for business plans, marketing strategy presentations, quarterly performance reports, and investor pitch decks. Ideal for marketing professionals, business analysts, sales teams, and executives who need to present quantitative comparisons and trend analysis.
-
Slide Structure
Each slide contains a title area and a grouped bar chart. The chart displays 4 categories on the X-axis and 2 data series (Value 1 and Value 2) with paired bars for each category. Clear legends and numerical labels enable immediate data comprehension and side-by-side value comparison.
Related Products
-

Bar Chart Visualizing Freight Transport Trends – Essential Market Analysis Tool
#Market and Competitor Analysis #Graph #Text Box
-

Market Competition: Deep Dive into Top 3 Firms
#Market and Competitor Analysis #Graph #Competitor Analysis
-

Visualize Market Analysis with Comparison Orange Bar Chart - Identify Competitive Edge
#Market and Competitor Analysis #Graph #Competitor Analysis
-

Market Insights Through Competition Analysis Chart – Gaining Competitive Edge
#Market and Competitor Analysis #Graph #Competitor Analysis
