Car Wide Template Table – Visualizing Financial Performance
RJ0200044_18
- Last Update 04/10/2025
- File Size 3.5MB
- # of Slides 2
- File Format PPTX
- Slide Ratio 16:9
- Color
Keywords
- #Content-Based Slides
- #Design-Based Slides
- #Financial Plans and Performance
- #Diagram
- #Sales and Revenue
- #Key Financial Indicators
- #16:9
- #financial performance PowerPoint slide
- #financial data table presentation
- #financial results visualization slide
- #financial report PPT design
- #data table PowerPoint template
About the Product
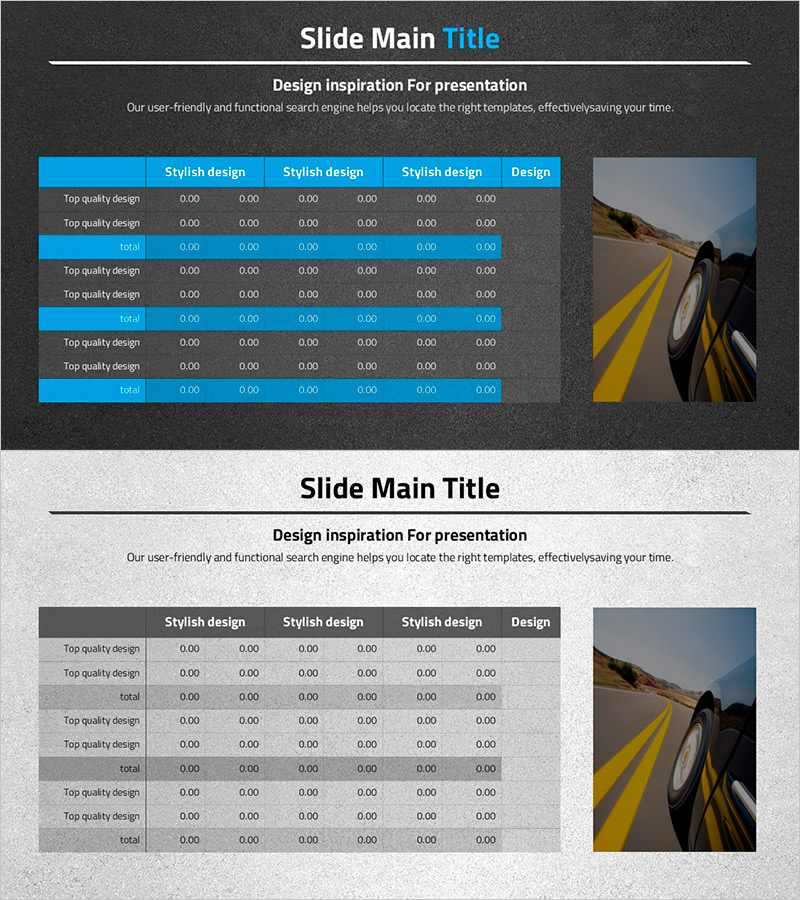
A 2-slide PowerPoint presentation designed to clearly visualize financial results and performance metrics. The layout combines a dark gray background with a blue header row, maximizing data readability and professional appearance. The slide structure includes a title and descriptive text area at the top, a multi-row and multi-column data table in the center, and an image insertion space on the right side. Created in 16:9 widescreen format, this PowerPoint slide is optimized for modern presentation environments and can be immediately used in investor reports, financial briefings, and executive presentations. All text and table data are fully editable, allowing you to customize the slide to match your company's specific financial figures and branding.
Usage Points
-
Main Usage
This slide systematically organizes and visualizes financial metrics and performance data to clearly communicate with investors, executives, and stakeholders. The multi-row and multi-column table layout enables complex financial information to be understood at a glance.
-
How to Use
Use this slide in investor pitch decks, quarterly financial reports, executive meeting materials, and financial briefing presentations. Replace the table headers and data cells with your company's actual financial figures, and insert your company logo or relevant visuals in the right-side image area to maintain brand consistency.
-
Recommended For
Recommended for CFOs, financial officers, IR specialists, executives, and investor relations teams preparing financial performance presentations, quarterly reports, investor briefings, shareholder meetings, and bank loan applications. Ideal for situations requiring credible financial communication.
-
Slide Structure
The slide consists of a title area at the top (1 row), descriptive text area (1 row), a multi-row and multi-column data table (8 rows × 7 columns), and a rectangular image insertion space on the right. Blue header rows and gray data rows alternate to clearly express information hierarchy.
Related Products
-

Comparative Analysis Graph by Year – Clearly Presenting Financial Results
#Financial Plans and Performance #Diagram #Sales and Revenue
-

Visualizing Key Financial Indicators for Business – Stability and Trust
#Financial Plans and Performance #Diagram #Sales and Revenue
-

Visualizing Key Financial Indicators with Diagram Presentation
#Financial Plans and Performance #Diagram #Sales and Revenue
-

Business Profit Analysis Table – Financial Performance and Strategy Analysis
#Financial Plans and Performance #Diagram #Sales and Revenue
