Banking Services Sector Analysis Graph – Market and Competitor Analysis
RJ0300081_11
- Last Update 05/11/2025
- File Size 9.5MB
- # of Slides 2
- File Format PPTX
- Slide Ratio 16:9
- Color
Keywords
- #Content-Based Slides
- #Design-Based Slides
- #Market and Competitor Analysis
- #Graph
- #Competitor Analysis
- #Competitive Advantage
- #Circles
- #Doughnut Chart
- #16:9
- #donut chart PowerPoint
- #pie chart slide template
- #market analysis diagram
- #circular graph presentation
- #financial data visualization
- #4-layer donut chart
About the Product
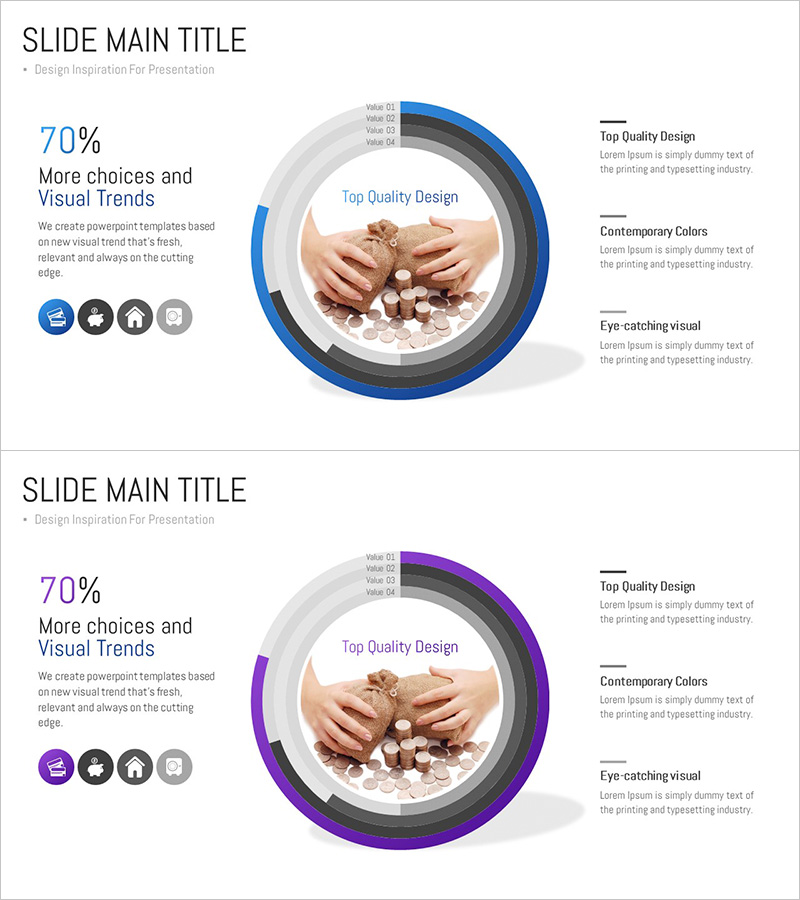
A donut chart PowerPoint slide designed for banking and financial market analysis. This template combines a central image area with four concentric data rings, enabling multi-layered visualization of market size, competitor comparison, and customer segmentation. The blue and purple dual-tone color scheme reinforces financial sector credibility and professionalism, while four icons on the left side provide visual category distinction. Delivered in 16:9 widescreen format with 2 slides, ready for immediate use in presentations, reports, and strategic proposals.
Usage Points
-
Main Usage
Ideal for visualizing complex financial data across multiple layers: market analysis, competitor benchmarking, customer segmentation, and service breakdown. The central image area accommodates product photos or brand logos, while the four outer rings display metrics, percentages, and categorical information with clear visual hierarchy.
-
How to Use
Edit the donut chart layers in the slide master to adjust colors and data values. Insert your bank logo or product image in the central circular area, and populate the right-side text box with analysis details. The four category icons are fully customizable, and color tones can be adjusted to match your presentation theme.
-
Recommended For
Finance professionals, market analysts, strategy planners, and sales teams in banking, insurance, and financial services. Highly effective for investor presentations, quarterly business reviews, marketing strategy decks, and executive briefing materials.
-
Slide Structure
2-slide set: Slide 1 features a blue-toned donut chart with 4 concentric rings, central image placeholder, 4 left-aligned category icons, and right-side text box. Slide 2 mirrors the design in purple tones. Each ring is labeled Value 01–04 and accepts custom data input and legend text.
Related Products
-

Business Competitive Advantage Analysis Graph – Differentiation in the Market
#Market and Competitor Analysis #Diagram #Graph
-

Cartoon Theme Analysis Donut Circle Graph – Visualizing Market Competitiveness
#Market and Competitor Analysis #Graph #Competitor Analysis
-

Current Status of Space Business Visualized with Donut Chart - Competitive Edge Analysis
#Market and Competitor Analysis #Graph #Competitor Analysis
-

Medical Market Share Donut Pie Chart
#Market and Competitor Analysis #Graph #Competitor Analysis
