Trade Services Schedule – Optimized Diagram for Business Management
RJ0300017_15
- Last Update 04/22/2025
- File Size 0.1MB
- # of Slides 2
- File Format PPTX
- Slide Ratio 16:9
- Color
Keywords
- #Content-Based Slides
- #Design-Based Slides
- #Business Management
- #Operational Plan
- #Diagram
- #Implementation Schedule
- #Project Implementation Schedule
- #Table
- #Standard Table
- #16:9
- #table diagram PowerPoint
- #arrow timeline slide template
- #4-stage process diagram
- #business management schedule PPT
- #weekly planning template download
About the Product
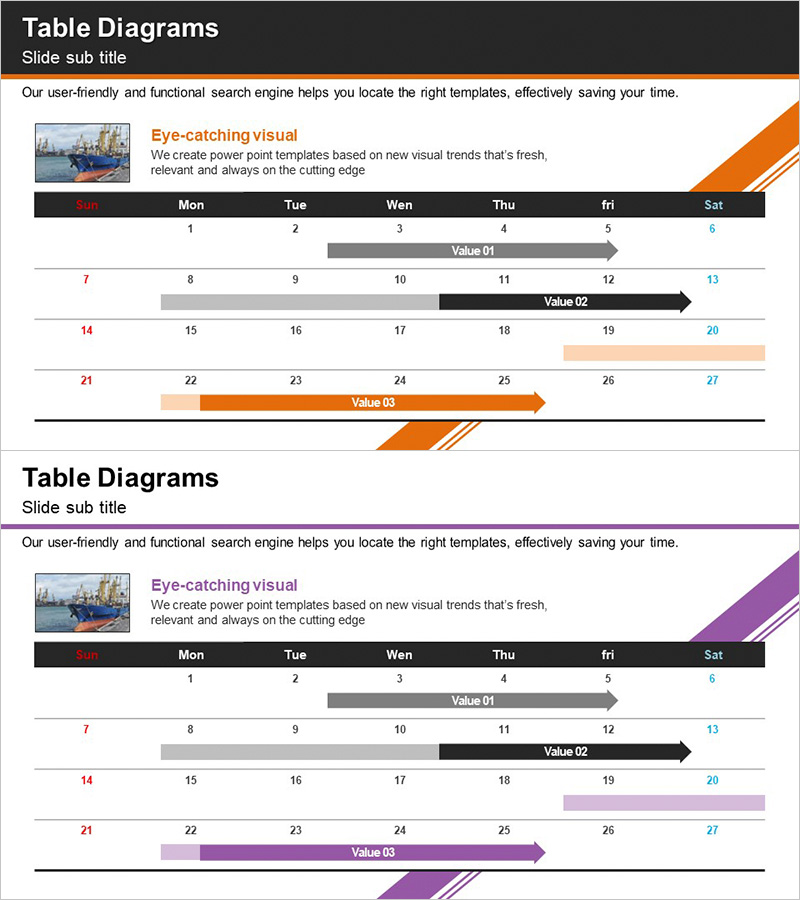
A horizontal arrow table diagram PowerPoint slide designed for visualizing trade services and business management schedules. This presentation template features a weekly schedule table and a 4-stage arrow structure for tracking multiple project values simultaneously. The design uses distinct color coding—orange, black, gray, and beige—to clearly differentiate each stage and progress status. Comprising 2 slides, this deck is ready to use for project timelines, milestone tracking, resource allocation, and business management presentations.
Usage Points
-
Main Usage
This table diagram enables at-a-glance tracking of weekly schedules and multi-project progress. Each row represents an independent project or task, while horizontal arrows indicate progression stages over time. Optimized for trade services, supply chain management, and business planning presentations.
-
How to Use
Slide 1 provides a basic weekly schedule table where you can input task names, assignees, and status in each cell. Slide 2 features 4 rows of arrow timelines—enter project names and adjust arrow length to reflect duration. Use the color coding system (orange, black, gray, beige) to distinguish priorities or status levels.
-
Recommended For
Ideal for trade companies, logistics firms, project management teams, and business development departments presenting to executives, strategy meetings, and client presentations. Particularly effective when explaining multi-project execution or sharing milestone-based schedules.
-
Slide Structure
Slide 1: 7-column (weekday) × 4-row table structure with input areas for schedule details. Slide 2: 4 rows of horizontal arrow timelines with Value 01–03 labels and time range indicators. Arrows feature gradient effects to emphasize stage progression, with a title area in the header section.
Related Products
-

Medical Product Differentiation Strategy Diagram
#Business Management #Operational Plan #Diagram
-

Show Paper Calendar Schedule – Effective Business Management
#Business Management #Operational Plan #Diagram
-

Displays the Schedule Step by Step – Clear Communication of Project Timeline
#Business Management #Operational Plan #Diagram
-

Curved Theme Purple Template Schedule – Efficient Operational Planning
#Business Management #Operational Plan #Diagram
