Future Planning Schedule – Business Execution Timeline Visualization
RJ0500036_23
- Last Update 06/16/2025
- File Size 0.5MB
- # of Slides 2
- File Format PPTX
- Slide Ratio 16:9
- Color
Keywords
- #Content-Based Slides
- #Design-Based Slides
- #Business Management
- #Operational Plan
- #Diagram
- #Implementation Schedule
- #Project Implementation Schedule
- #Table
- #Standard Table
- #16:9
- #horizontal bar timeline PowerPoint
- #business schedule template
- #project timeline slide
- #annual planning diagram
- #operational plan visualization PPT
- #how to create timeline chart in PowerPoint
About the Product
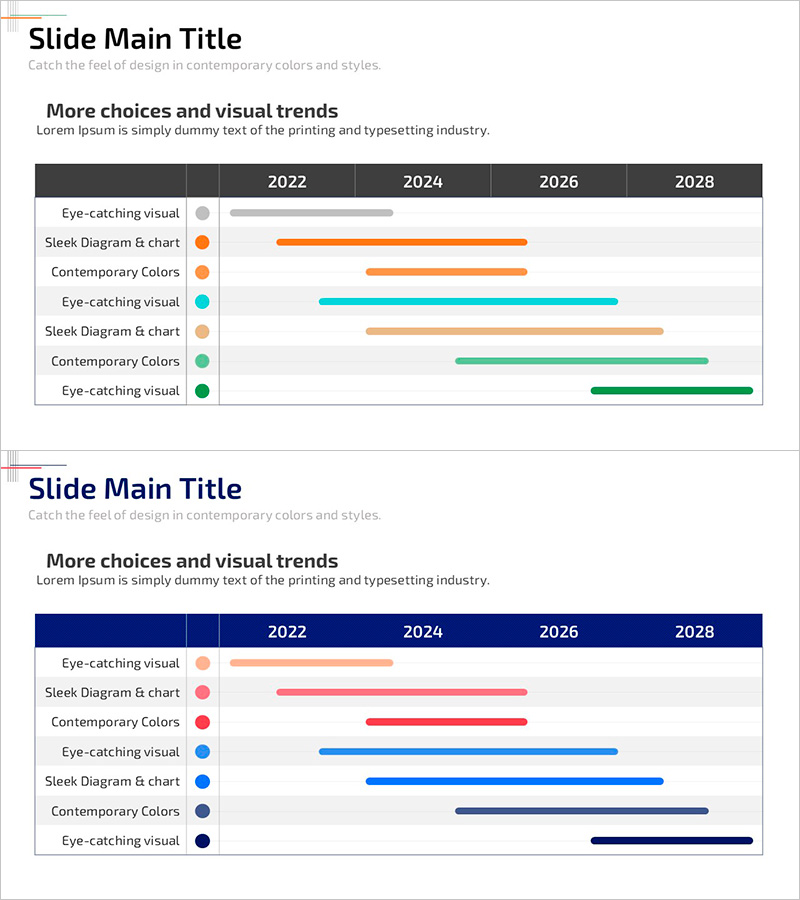
A horizontal bar timeline PowerPoint slide that visualizes business execution schedules and future planning from 2022 to 2028. Seven distinct items are displayed across four year intervals, each represented in different colors including orange, pink, blue, and green for clear differentiation. This slide deck is immediately applicable to presentations requiring mid-to-long-term schedule management such as company operational plans, business execution strategies, and product development roadmaps. Provided in 16:9 PPTX format with fully editable text and numerical data.
Usage Points
-
Main Usage
Visualizes mid-to-long-term business execution schedules, project roadmaps, and annual operational plans at a glance. Horizontal bars represent duration for each item, intuitively conveying timeline overlaps and sequential relationships across years.
-
How to Use
Use in the strategy and planning sections of presentations to explain business execution timelines, product development schedules, or marketing campaign calendars. Modify text, years, and colors to match your data and apply directly to meetings, reports, and investor pitch decks.
-
Recommended For
Business planners, project managers, marketing professionals, and executives preparing management reports benefit from this layout. Suitable for business plans, proposals, investor relations presentations, and operational planning decks.
-
Slide Structure
Two-slide layout with the first slide featuring seven items arranged across four year intervals (2022, 2024, 2026, 2028) in a horizontal bar timeline format. Each item is assigned a distinct color—orange, pink, blue, green, and beige—to clearly differentiate data series and improve readability.
Related Products
-

Curved Theme Purple Template Schedule – Efficient Operational Planning
#Business Management #Operational Plan #Diagram
-

Trade Services Schedule – Optimized Diagram for Business Management
#Business Management #Operational Plan #Diagram
-

Volume Calendar Template for Efficient Business Management
#Business Management #Operational Plan #Diagram
-

Surgery Schedule Planning – Effective Business Management
#Business Management #Operational Plan #Diagram
