Orange Hexagon Template – Segmented Horizontal Bar Graph
RJ0200038_22
- Last Update 04/08/2025
- File Size 1.1MB
- # of Slides 2
- File Format PPTX
- Slide Ratio 16:9
- Color
Keywords
- #Content-Based Slides
- #Design-Based Slides
- #Business Strategy
- #Market and Competitor Analysis
- #Graph
- #Other
- #Future Outlook
- #Horizontal Bar
- #Segmented Horizontal Bar
- #Mockup
- #Project Progress
- #16:9
- #segmented horizontal bar chart PowerPoint
- #year-over-year comparison slide
- #business progress chart template
- #multi-series bar graph
- #PowerPoint chart slide design
About the Product
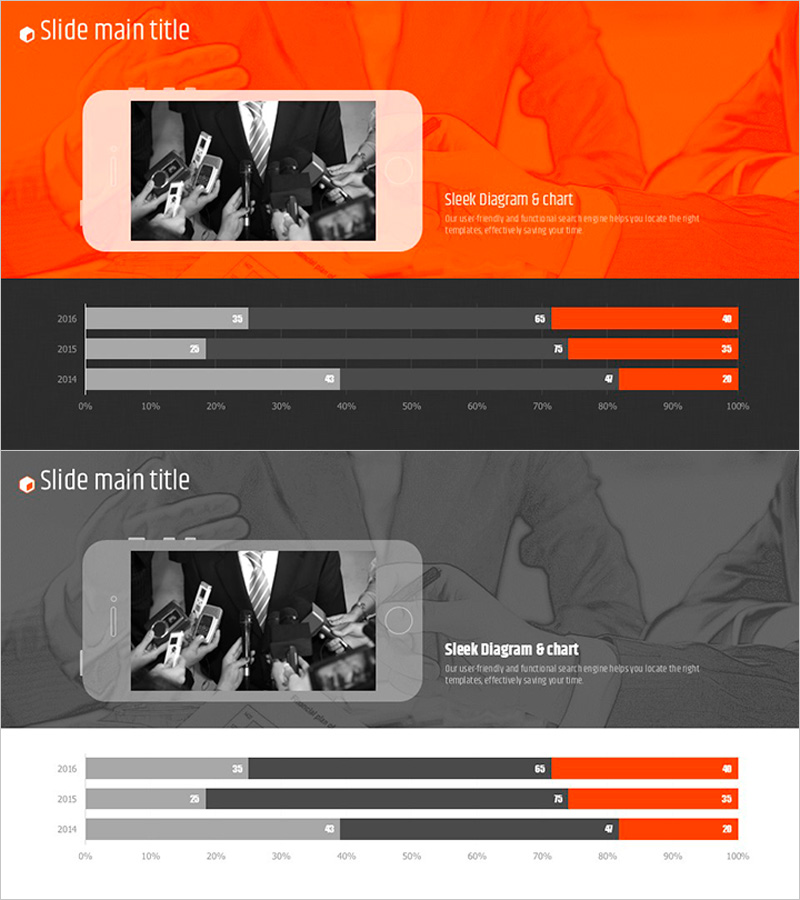
A segmented horizontal bar chart PowerPoint slide designed to visualize business progress and market analysis across multiple years. The design combines orange as the primary color with gray accents to clearly differentiate data series. The chart displays three years (2016, 2015, 2014) with three data series each, representing progress from 0% to 100% on a horizontal scale. This slide template is ideal for business presentations, annual reports, market analysis decks, and competitive benchmarking. The 16:9 widescreen format includes 2 slides in fully editable PPTX format, allowing you to customize data values, labels, and colors to match your presentation needs.
Usage Points
-
Main Usage
This chart excels at comparing performance metrics across multiple years or categories using three distinct data series. It's particularly effective for displaying business progress, market share trends, departmental performance, or competitive analysis in executive presentations, annual reports, and strategic planning documents.
-
How to Use
Simply update the bar lengths and values to reflect your actual data. Use the orange series for primary metrics, gray for secondary data, and black for tertiary information to create clear visual hierarchy. During presentations, highlight year-over-year trends and performance gaps between series to emphasize key insights.
-
Recommended For
Ideal for executives, business managers, and marketing professionals presenting quarterly or annual performance reviews. Commonly used in investor pitch decks, business proposals, market research reports, and strategic planning presentations where quantitative data credibility is essential.
-
Slide Structure
Two-slide layout. The first slide features an orange background with black-and-white imagery, title, and descriptive text area. The second slide contains a horizontal bar chart with three years (2016, 2015, 2014) and three data series (orange, gray, black), with each bar representing 0-100% progress on a horizontal axis.
Related Products
-

Modern Business PowerPoint Template – Business Strategy and Market Analysis
#Business Strategy #Market and Competitor Analysis #Graph
-

Bar Chart for Market Analysis Visualization – Innovation and Growth
#Business Strategy #Market and Competitor Analysis #Graph
-

Horizontal Bar Segmentation Graph for Market Trend Analysis – Establishing Business Strategy
#Business Strategy #Market and Competitor Analysis #Graph
-

Visualizing Market Analysis with Modern Blue Line Chart – Digital Marketing Strategy
#Market and Competitor Analysis #Graph #Other
