Modern Blue Bar Chart for Performance Visualization – Business Strategy
RJ0200035_7
- Last Update 04/08/2025
- File Size 0.8MB
- # of Slides 2
- File Format PPTX
- Slide Ratio 16:9
- Color
Keywords
- #Content-Based Slides
- #Design-Based Slides
- #Business Strategy
- #Graph
- #Achievements
- #Horizontal Bar
- #Segmented Horizontal Bar
- #Project Progress
- #16:9
- #100% stacked bar chart PowerPoint
- #stacked bar graph template
- #year-over-year comparison slide
- #performance visualization chart
- #business progress chart
About the Product
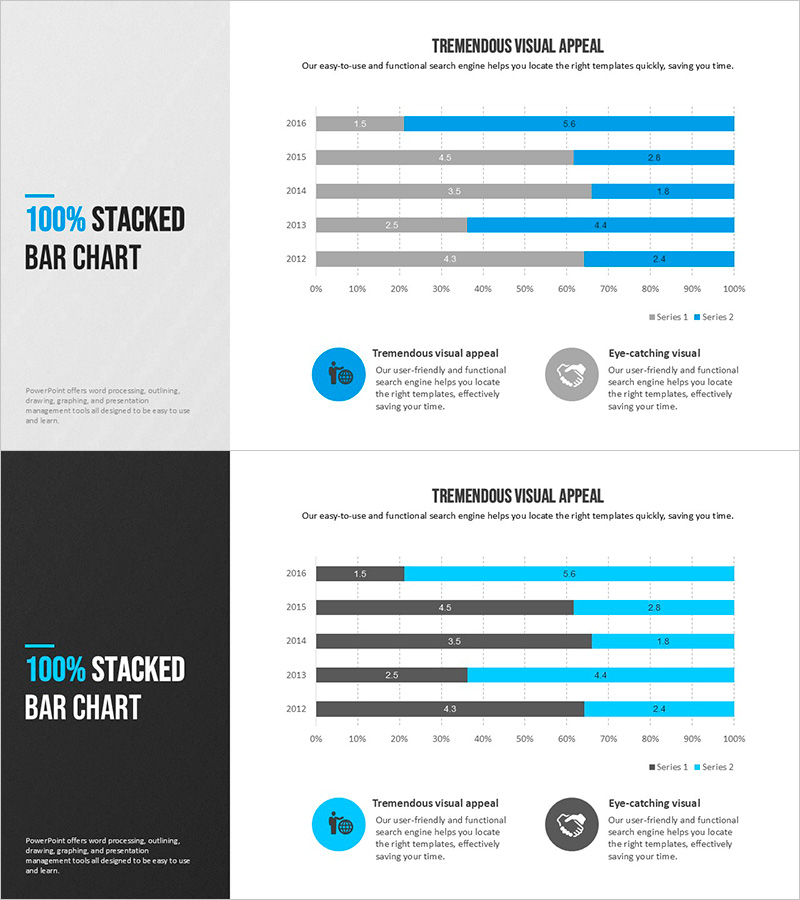
A 100% stacked bar chart PowerPoint slide for comparing performance across two data series by year. The slide features light gray and bright blue bars representing data from 2012 to 2016, with each bar normalized to 100% to clearly show ratio changes over time. Ideal for business strategy presentations, performance analysis, and management reports. The template includes two design variations: one with a light background and one with a dark background, both ready to use in your presentation deck.
Usage Points
-
Main Usage
Designed to display year-over-year performance changes and the proportional relationship between two data categories simultaneously. The 100% normalized stacked structure clearly visualizes compositional ratio shifts across years, making it ideal for business strategy presentations and management performance reports.
-
How to Use
Use this slide in the business progress section when explaining year-over-year performance metrics. The two-series structure automatically calculates proportions when you input your data, making it adaptable for marketing performance, revenue composition, project completion rates, and other comparative datasets.
-
Recommended For
Recommended for executives, business planners, marketers, and finance professionals preparing quarterly or annual performance reports. Particularly effective when emphasizing compositional changes in two key performance indicators.
-
Slide Structure
Each slide contains a title area, a 100% stacked bar chart covering five years with two data series, a legend, and descriptive text. Two complete slide layouts are provided—one with a light background and one with a dark background. Each bar is color-coded with gray and blue segments.
Related Products
-

Spring Pastel Wide PowerPoint Template Diagram – Business Strategy and Structure
#Business Strategy #Diagram #Achievements
-

Orange Hexagon Template – Segmented Horizontal Bar Graph
#Business Strategy #Market and Competitor Analysis #Graph
-

Horizontal Bar Chart for Annual Coffee Consumption – Business Strategy
#Business Strategy #Market and Competitor Analysis #Graph
-

Yellow Green Detailed Analysis Chart - Visualizing Market Trends
#Business Strategy #Market and Competitor Analysis #Diagram
