Four Color Infographic Flow Linear Diagram – Visualizing Business Strategy
RJ0200037_8
- Last Update 04/08/2025
- File Size 0.8MB
- # of Slides 2
- File Format PPTX
- Slide Ratio 16:9
- Color
Keywords
About the Product
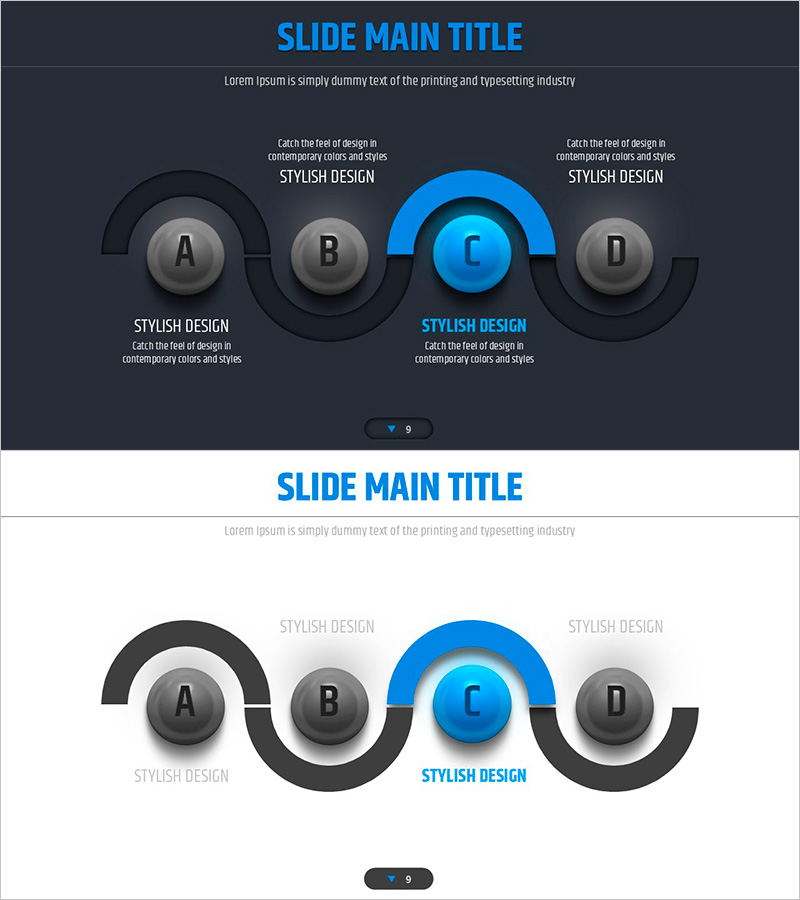
A four-color linear flow diagram PowerPoint slide that visualizes business strategy and process progression through four sequential stages. Featuring a dark gray background with bright blue accent color, the design connects four spherical nodes (A→B→C→D) with curved connector lines to represent step-by-step advancement. Each node provides an input area for stage names or key items, with description text zones above and below for detailed information. This two-slide set includes both dark and light background versions, making it immediately applicable to business strategy presentations, operational planning, project roadmaps, and process documentation across various corporate contexts.
Usage Points
-
Main Usage
Visualize business strategy, operational planning, process stages, and project roadmaps through a clear four-step linear progression. Input stage names or key items into each node and add detailed descriptions in the text zones to effectively communicate sequential processes to audiences during strategy presentations, business briefings, and internal reports.
-
How to Use
Enter stage names or key items in each node (A, B, C, D) and fill in the description text areas above and below with relevant details, objectives, or outcomes. Use the dark gray background version for formal external presentations and reports, and the light background version for internal meetings and training materials to match your presentation context.
-
Recommended For
Strategy planning teams, business development managers, project managers, marketing professionals, and executives responsible for business reporting. Ideal for presentations emphasizing step-by-step progression, process improvement initiatives, roadmap sharing, and strategic planning communications.
-
Slide Structure
Two-slide set with title area at top, four spherical nodes connected by curved lines forming a linear flow diagram in the center, and text input zones above and below each node for descriptions. Includes both dark gray background and light background versions for flexible presentation styling.
Related Products
-

Learning Arrow Flow and Description – Business Strategic Planning
#Business Strategy #Operational Plan #Diagram
-

Mental Wellness Process Flow Diagram Slide
#Business Strategy #Operational Plan #Diagram
-

Presentation Template for Business Strategy Using Arrow Diagram
#Business Strategy #Operational Plan #Diagram
-

Directional Flow Diagram for Business Strategy PPT
#Business Strategy #Operational Plan #Diagram
