Hand Shape Market Trends and Sales Revenue – Practical Graph Slide
RJ0400003_5
- Last Update 05/17/2025
- File Size 3.9MB
- # of Slides 2
- File Format PPTX
- Slide Ratio 16:9
- Color
Keywords
- #Content-Based Slides
- #Design-Based Slides
- #Market and Competitor Analysis
- #Financial Plans and Performance
- #Graph
- #Industry Trends
- #Sales and Revenue
- #Column
- #Column Chart
- #16:9
- #clustered column chart PowerPoint
- #multi-series bar chart slide
- #hand icon graph template
- #sales comparison chart
- #business data visualization PPT
- #infographic column chart
About the Product
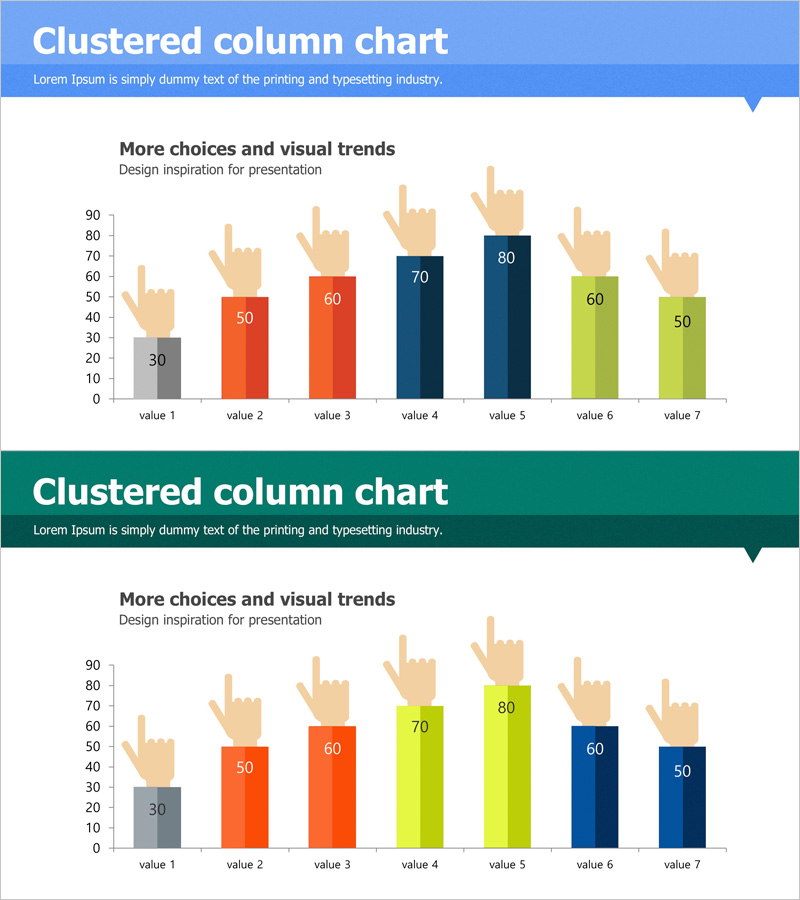
A PowerPoint slide featuring a hand-shaped clustered column chart designed to visualize market trends and sales revenue data. The slide displays 7 data points with 3 color-coded series (gray, orange, navy, and lime green), each topped with a hand icon for infographic impact. Perfect for presenting financial performance, quarterly results, departmental sales comparisons, and other multi-series business metrics. The 2-slide template is fully editable in PowerPoint, allowing you to customize data values, colors, and labels to match your presentation needs.
Usage Points
-
Main Usage
Effectively compare multi-series financial data such as quarterly performance, departmental revenue, product sales, and market metrics. The hand-shaped icons add visual interest and infographic appeal, making complex numerical data more engaging and easier for audiences to understand at a glance.
-
How to Use
Ideal for investor presentations, executive reports, quarterly earnings announcements, and marketing strategy meetings. The stacked columns with distinct colors clearly differentiate data series, while the hand icons serve as visual anchors. Easily modify data values, axis ranges, and colors directly in PowerPoint to match your specific metrics.
-
Recommended For
Finance teams, marketing departments, sales divisions, and executive leadership requiring data-driven presentations. Effective for quarterly performance reviews, product sales tracking, regional revenue comparisons, customer satisfaction trends, and competitive market analysis.
-
Slide Structure
2-slide template. Slide 1 features a blue header with title area. Slide 2 displays 7 data points (value 1–7) with 3 clustered columns per point, each topped with a hand icon. Y-axis ranges from 0 to 90 with numeric labels on each bar. 16:9 aspect ratio, fully editable PPTX format.
Related Products
-

Vertical Bar PC Mockup Graph – Market and Competitive Analysis
#Market and Competitor Analysis #Graph #Other
-

Four Color Infographic Bar Chart Presentation Template for Financial Analysis
#Market and Competitor Analysis #Financial Plans and Performance #Graph
-

Modern Theme Bar Graph – Optimized Design for Market Analysis
#Market and Competitor Analysis #Graph #Market Analysis
-

Visualizing Business Strategies with Tables & Charts – Clear Data Presentation
#Business Strategy #Financial Plans and Performance #Diagram
